Previewing Collection Data
Preview Jobs can be used to see the shape of the data being collected, just like a normal capture. Let's run a preview job, and take a look at the data.
-
If you're not already here: Click
Criblon the top row of tabs, then withManageactive in Stream's top nav, selectDataand clickSources. -
Click into
S3under theCollectorssection. -
Click the
Runbutton next to thepan-logscollector you configured earlier, and theRun configurationmodal will appear. -
Accept the default values (which include
Previewmode), and clickRun. ThePreviewmodal should appear and start capturing data. After either the time expires, or the defined number of events are captured, you should see something similar to this: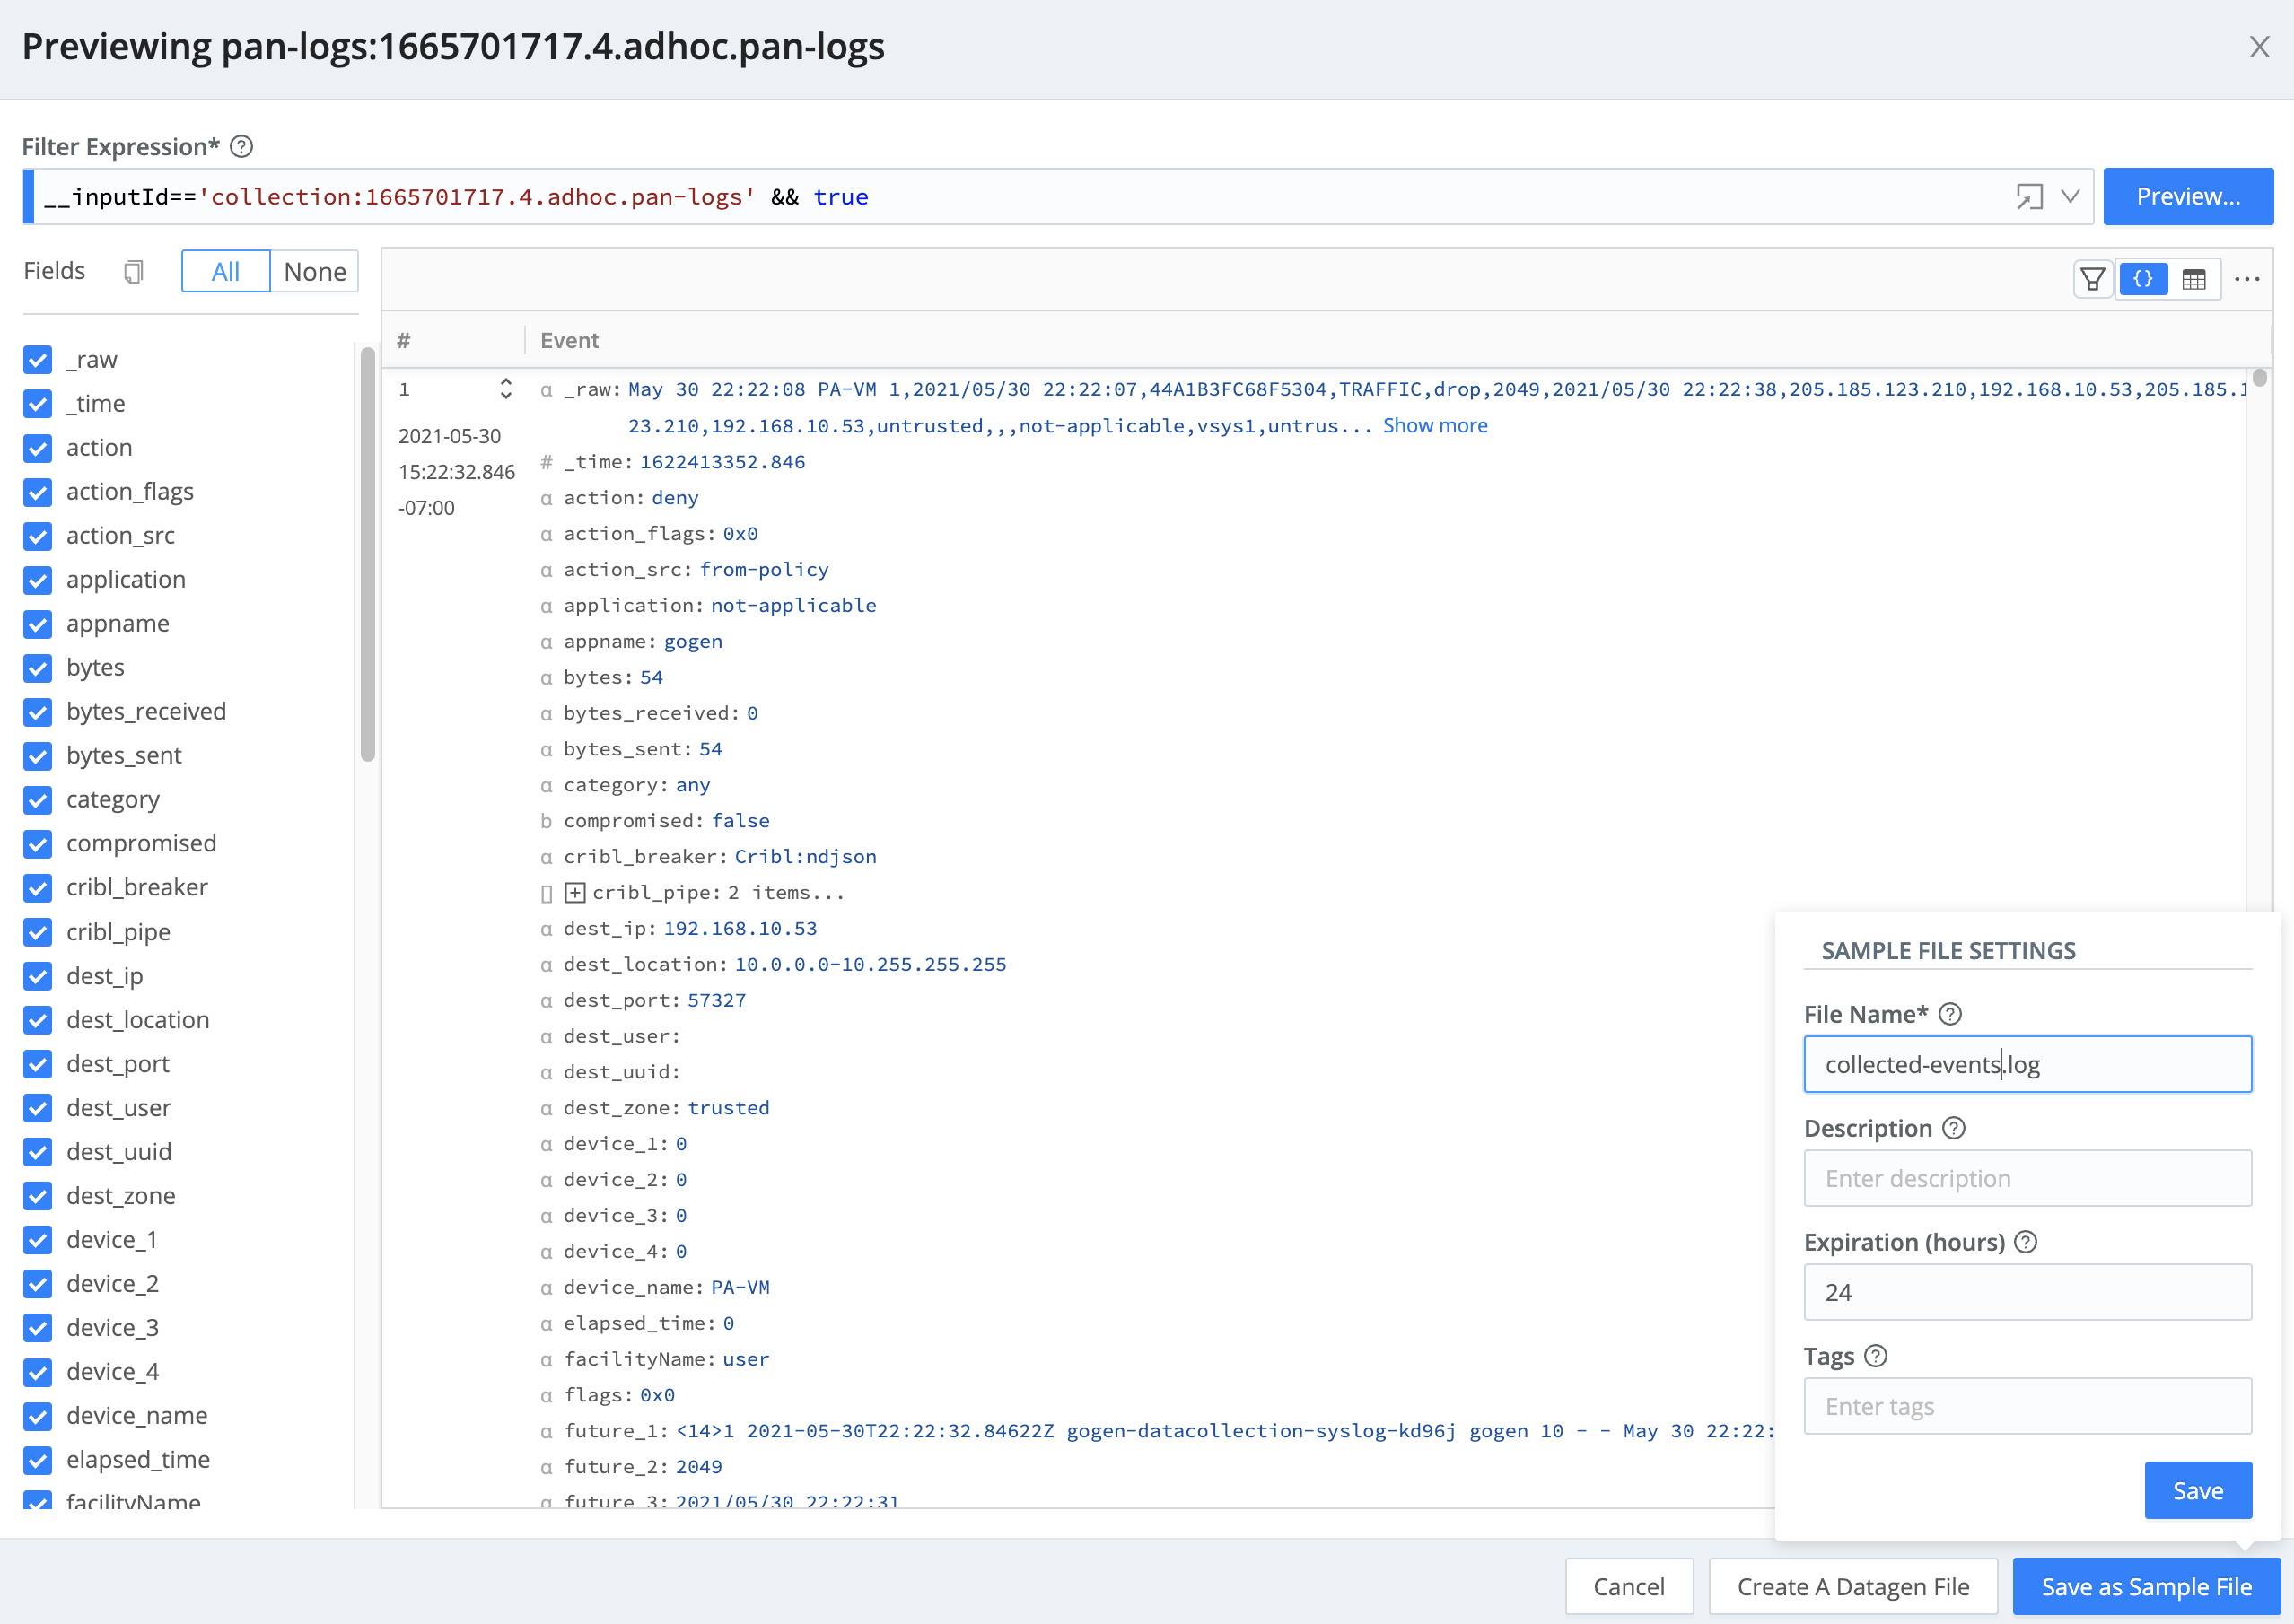 note
noteNow is a great time to take a closer look at the data that we just captured.
- At the
Previewingmodal's upper right, click on the..., and enable theShow Internal Fieldstoggle. - You should now see a number of internal fields with names that start with
__. A few that are relevant to collected data:
__channel Contains a unique identifier for one of the tasks' data streams. The Event Breaker engine uses this to ensure that streams are not mixed. __collectible This shows you metadata about the collection job itself. __inputId If data comes from a collection, the value of this will be collection:<collection job ID>.__isBroken Indicates whether this record has been "broken" by an Event Breaker ruleset (e.g., the Cribl ruleset we used to configure the collector). Of course, any of these fields' values are available to you for Route/Pipeline/Function filters, etc.
- At the
-
We want to save this previewed data for later use, so click
Save as Sample Fileand in theFile Namefield, entercollected-events.logthen click Save.
When you are done exploring the data, click the X at the top right corner of the preview modal to dismiss it.
Next, let's run a discovery job...