Generating Batch Metrics
In our scenario, we've got archived firewall data. Let's say we want to take all of that data and generate some metrics on it, without actually sending all of the data to Elasticsearch.
This is something that many Stream customers do with their streaming data, and is a great example of being able to bring all of the power of Stream to batch data ingestion.
In this scenario, we're going to generate some very simple aggregations of firewall traffic – basically session count and traffic, sliced by both source IP address and destination IP address. In other words, a simple "Top Talkers" report.
If you click the Kibana - Dashboard upper tab, you'll see a dashboard that's expecting data of sourcetype firewall_metrics, but that has no results in it. We're going to change our pipeline to create those results, and then ingest all of the data in our archive to fill it in.
If you haven't already, click the Kibana - Dashboard upper tab, and it should look something like this: 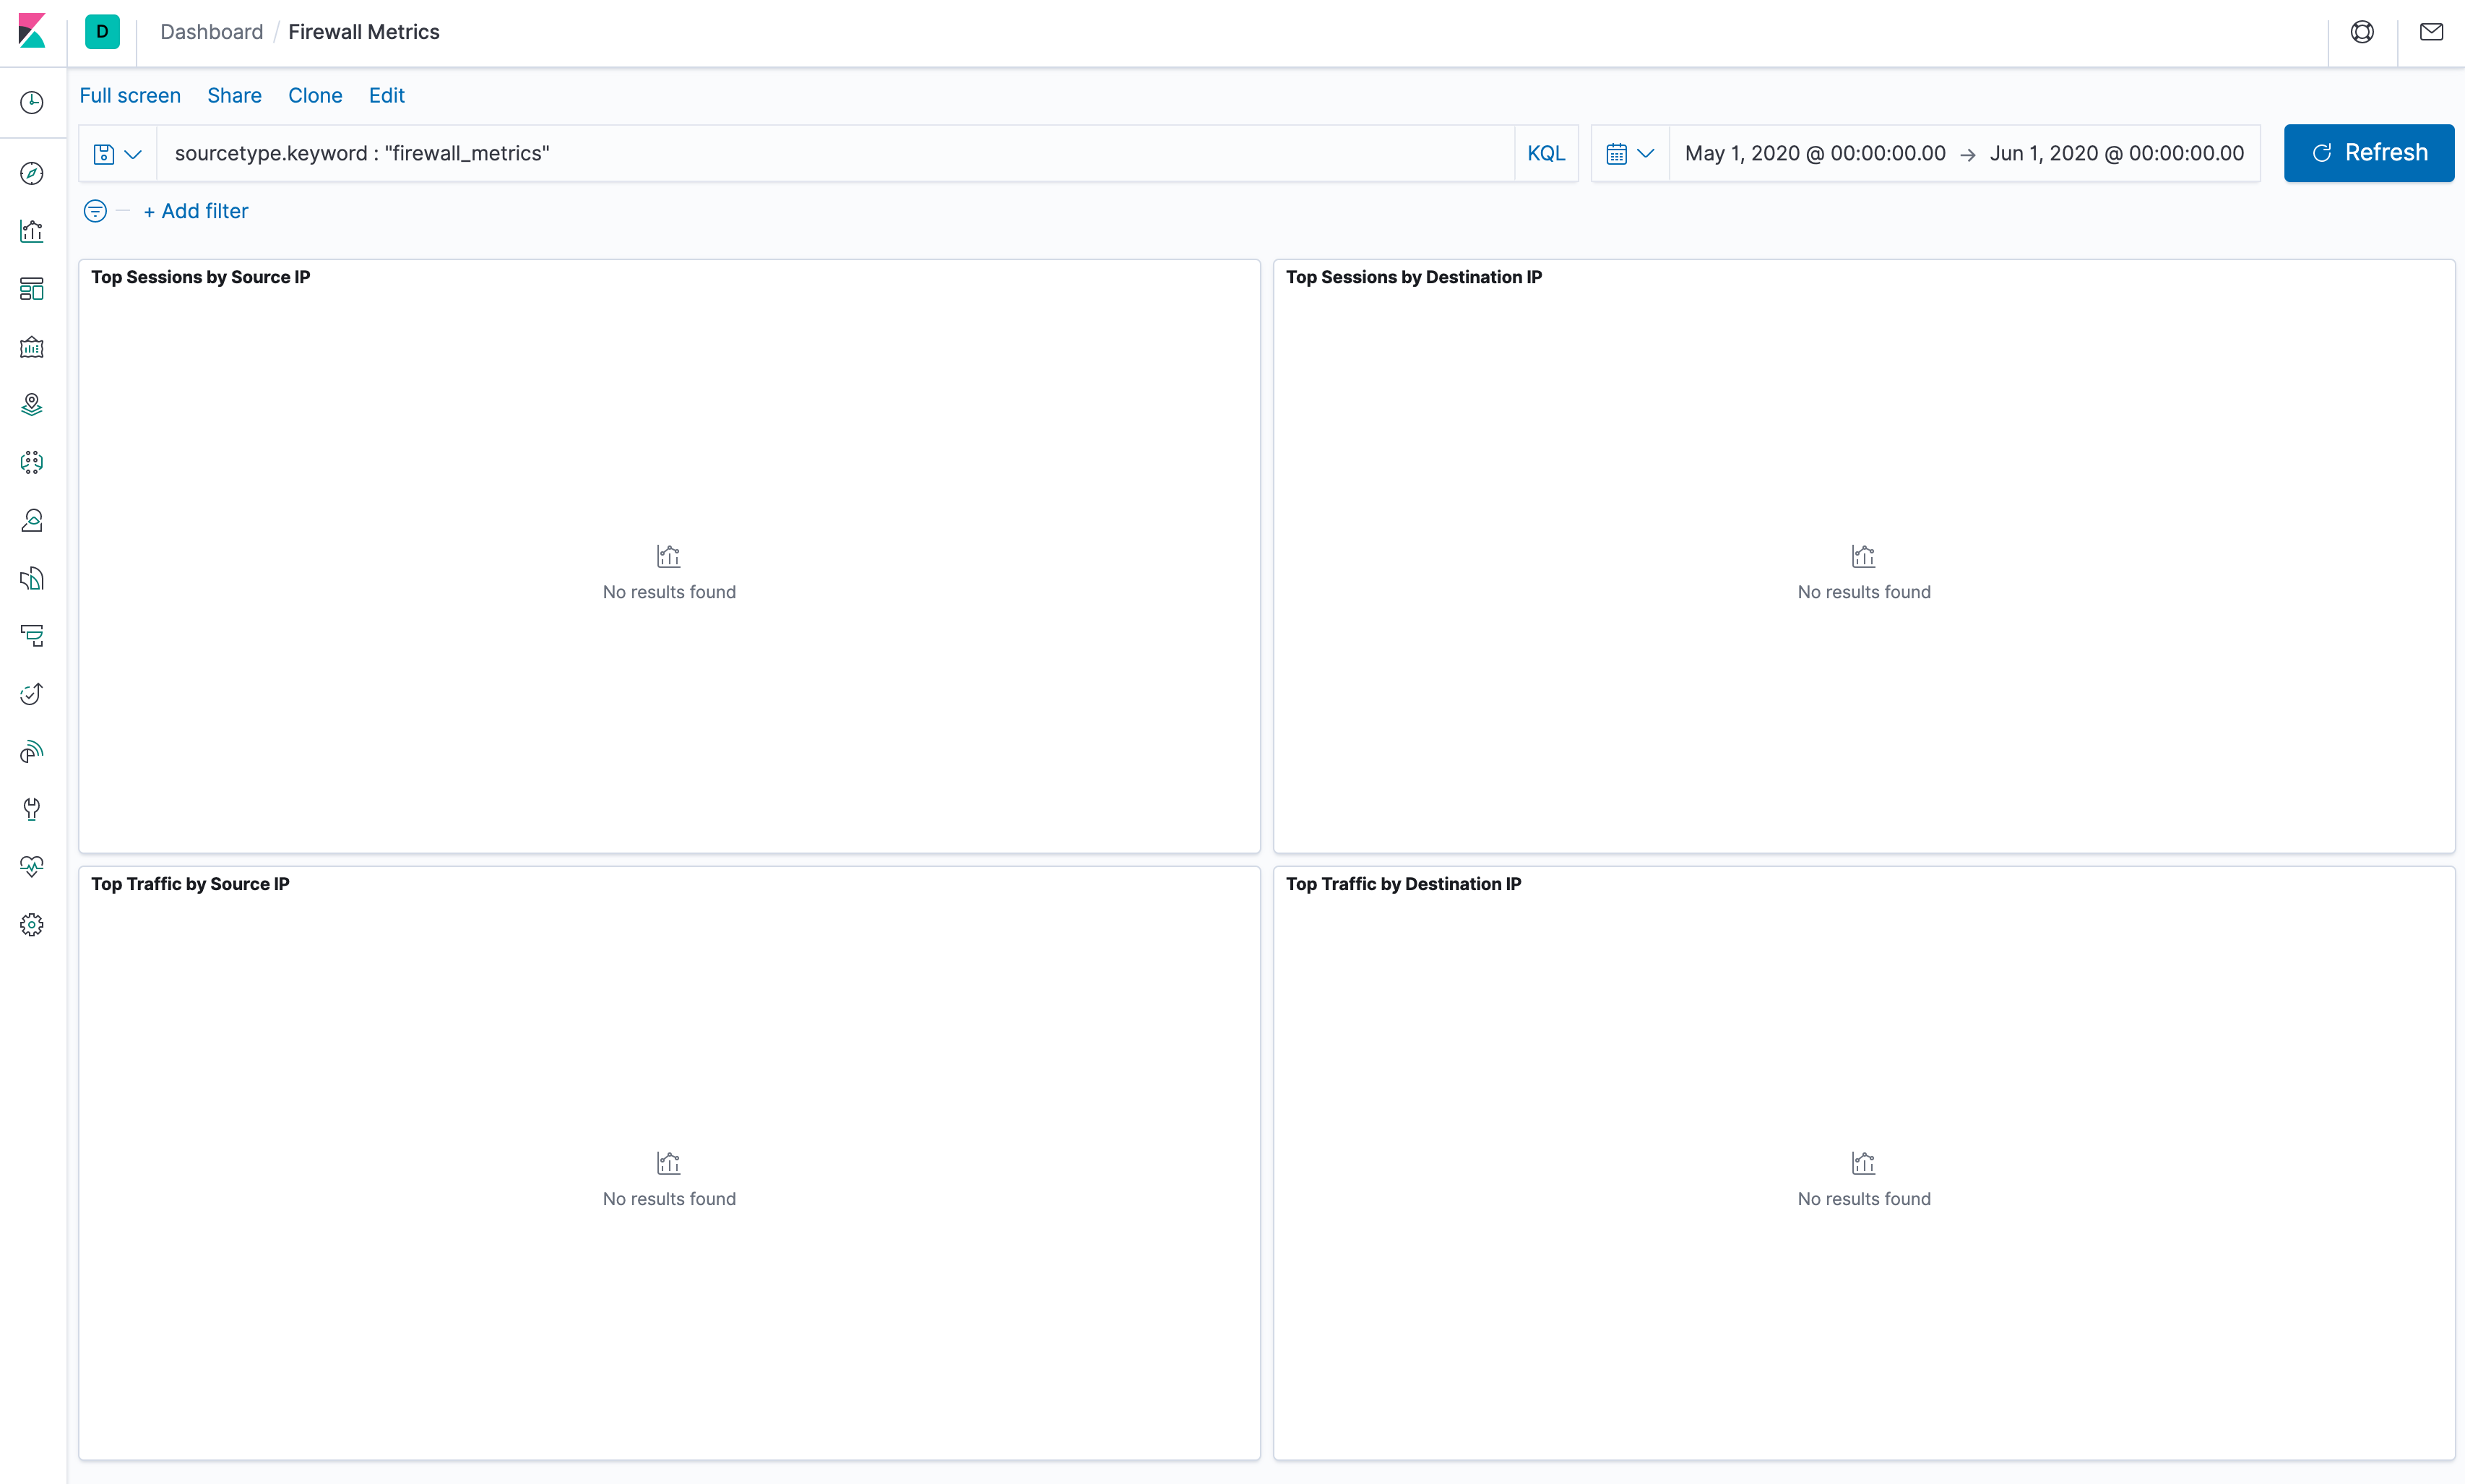
Let's go aggregate some data!