Aggregating the Data
To create our metrics, we're going to create a new Pipeline, add a couple of Functions to it, and then – in our collector – replace the passthru Pipeline reference with the new Pipeline.
- Click the
Criblupper tab. - In Stream's top menu, with
Manageactive, selectProcessingand clickPipelines. - Click
Add Pipelineand selectCreate Pipelinefrom the resulting drop-down. - In the
IDfield, enterfirewall_metrics, and clickSave.
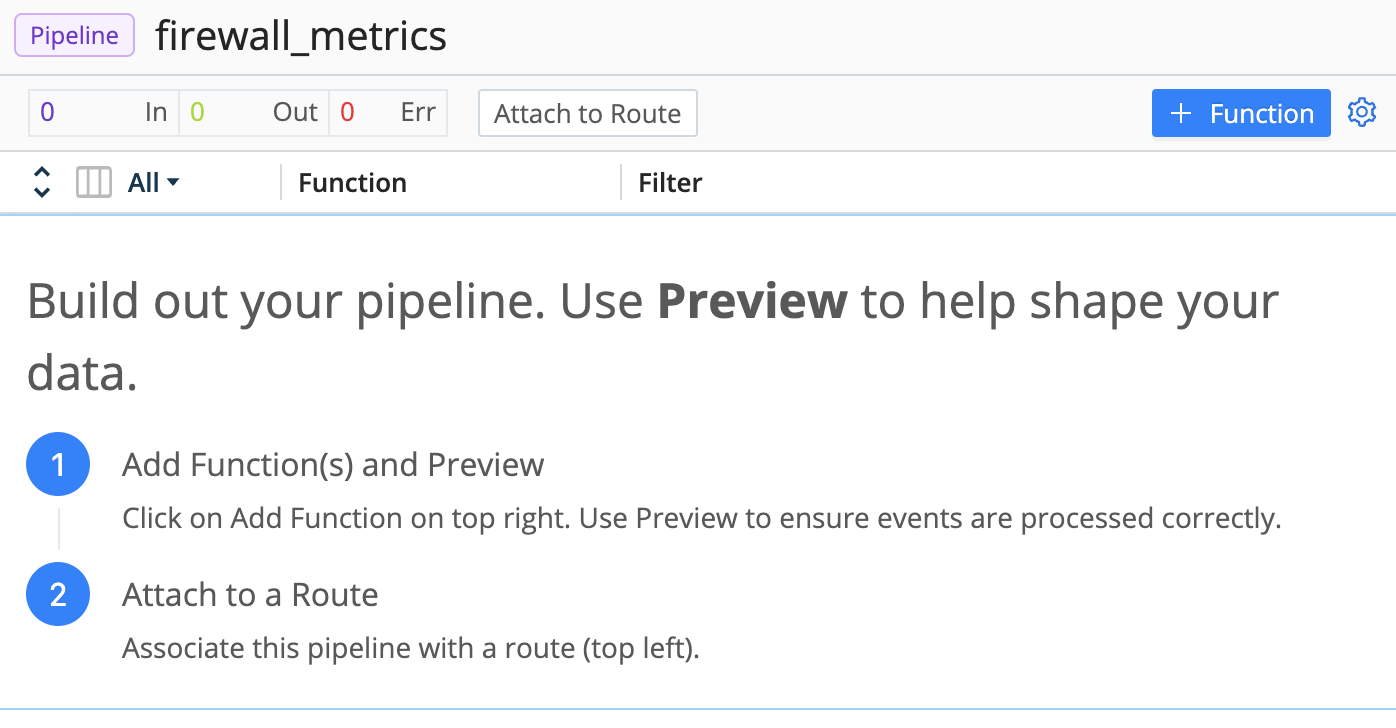
This should create the Pipeline and put you into the Pipeline editing page for the new Pipeline, like this:
Our Kibana Dashboard expects aggregated data, grouped by source IP address and destination IP address. We need to do a few things to get our data into proper shape to fill out that Dashboard.
- In the right pane, click the
Simplelink to the right of the sample file we saved during preview (collected-events.log). - Once the events are displayed in the right Preview pane, click the
OUTbutton so that you'll see the Pipeline's transformations of the data. - Click
Add Functionand selectStandard>Numerify(or just typeNumerifyinto the search box), and then clickSave.
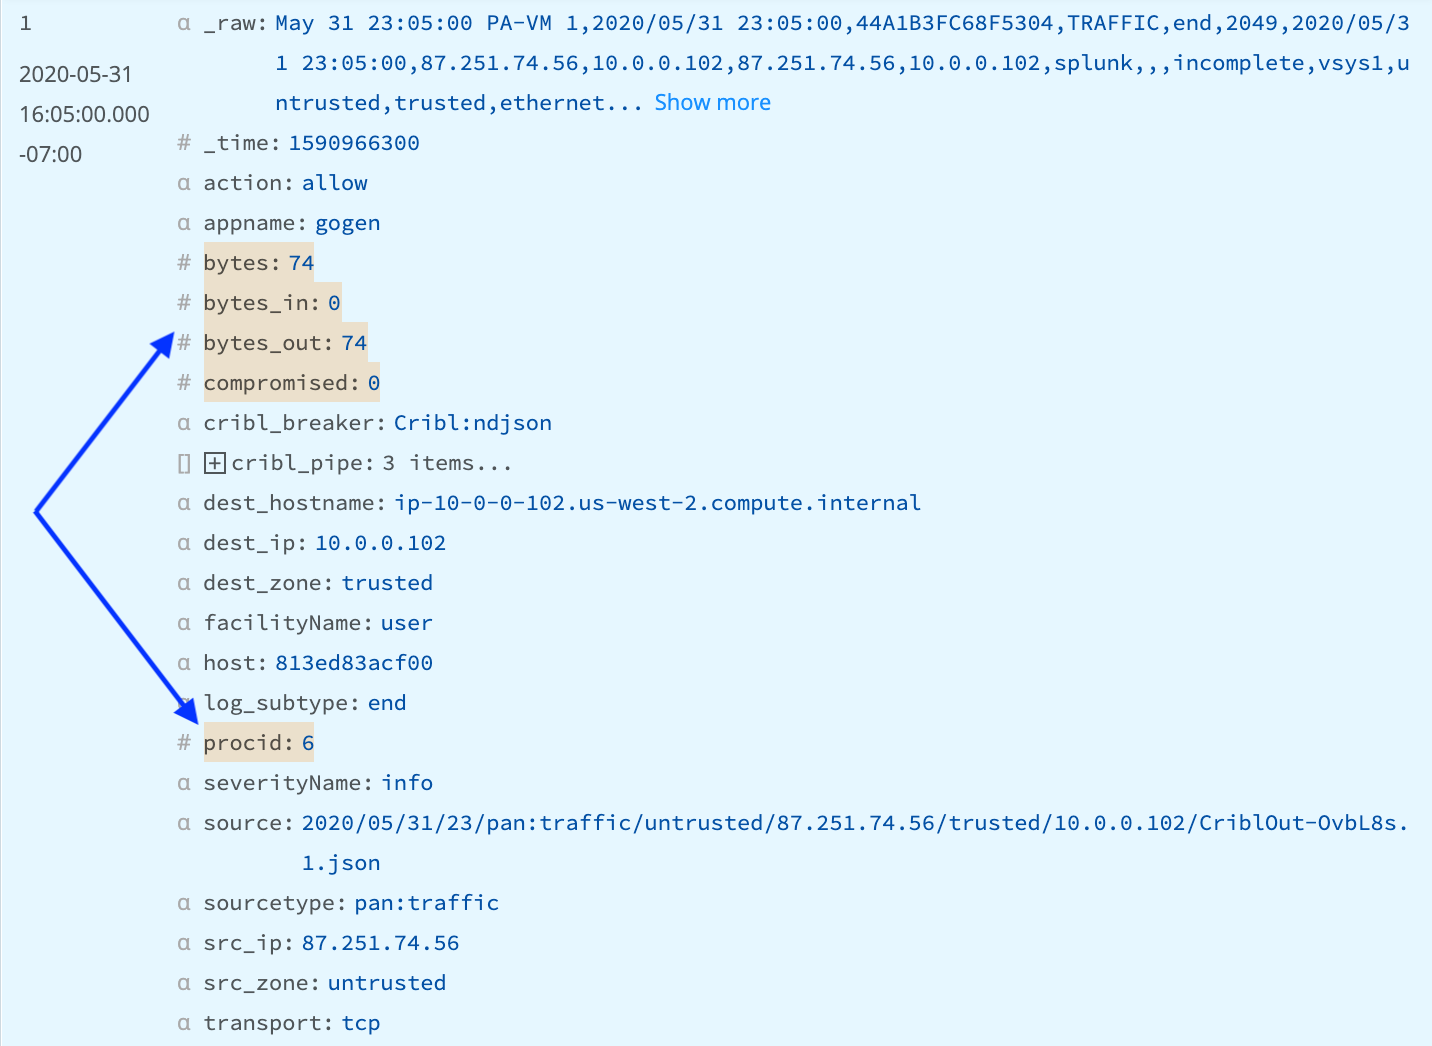
At this point, you should see a number of fields in the sample on the right change color, as shown in the example below. The Numerify Function looks through the event, and converts any values that contain only numeric data to numbers. This will allow us to do aggregations on those fields.
Next, we'll add another Function to do the aggregations. Our Dashboard has two values (count of sessions and total data transferred), grouped by two fields (src_ip and dest_ip).
- Click
Add Functionand selectAggregationsfrom the Standard menu. - In the
Aggregatesfield, entercount(). - In
Group by Fields, enter bothsrc_ipanddest_ip. (Press yourEnterorReturnkey between these two field names.) - Click
Save.
Now, the sample data on the right will largely get struck out. But if you scroll down to about record 101, you'll see a new structure that's being created, like this:
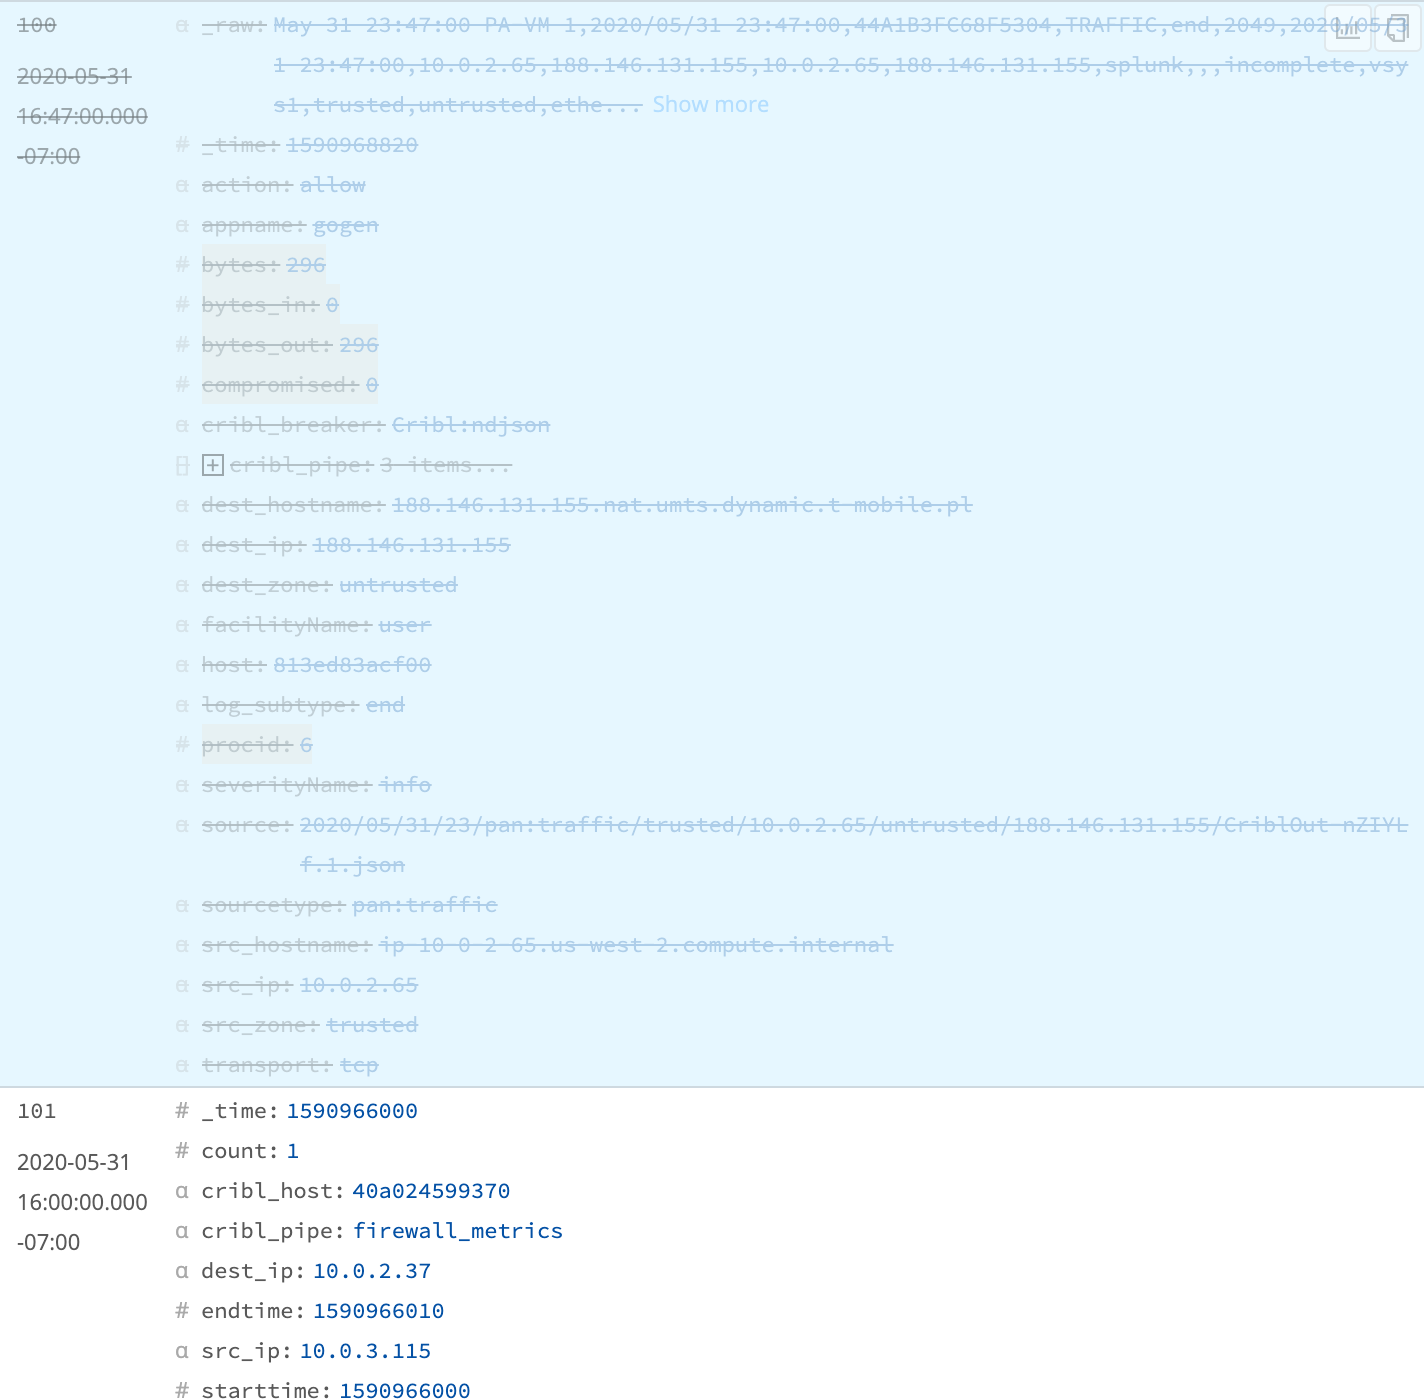
The original records are effectively being dropped after aggregations are run, and the only records that will now make it out of the Pipeline will be the new aggregated ones.
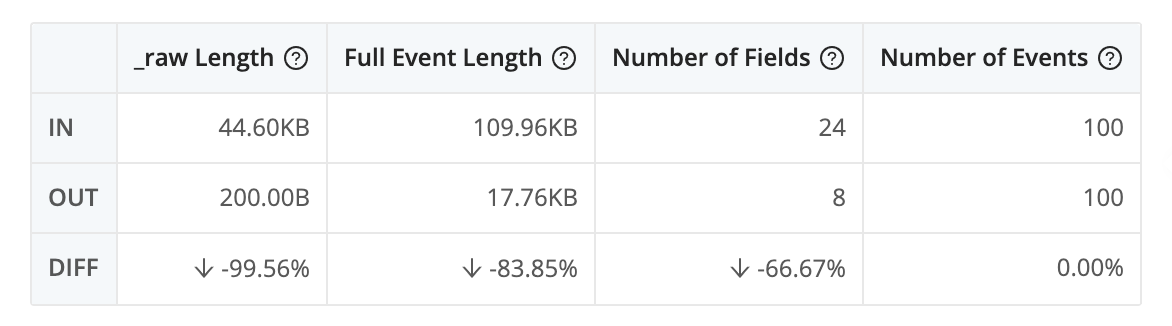
Since this data has high cardinality, this does not reduce the number of records. But if you click on the Pipeline diagnostics icon (next to Select Fields, towards the top of the right pane), you'll see that replacing the original data with aggregations reduces the amount of data you'll be sending to the destination by somewhere around 85%.
However, we still need another metric aggregated: the sum of the bytes.
- In the
AggregationsFunction'sAggregatessection, clickAdd Aggregate. - In the new row that appears, enter
sum(bytes)and clickSave.
Again, looking at the sample results, you should now see all of the aggregated records add a bytes_sum field. We're almost ready to start feeding out data to our Dashboard. But first, we need to set the sourcetype to what Kibana is expecting, firewall_metrics.
- In the
AggregationsFunction, this time clickAdd Fieldin theEvaluate Fieldssection. - In the
NameField, entersourcetype. - In the
Value Expressionfield, enter'firewall_metrics'. (Include the single quotes.) - Click
Save. The screen should look something like this: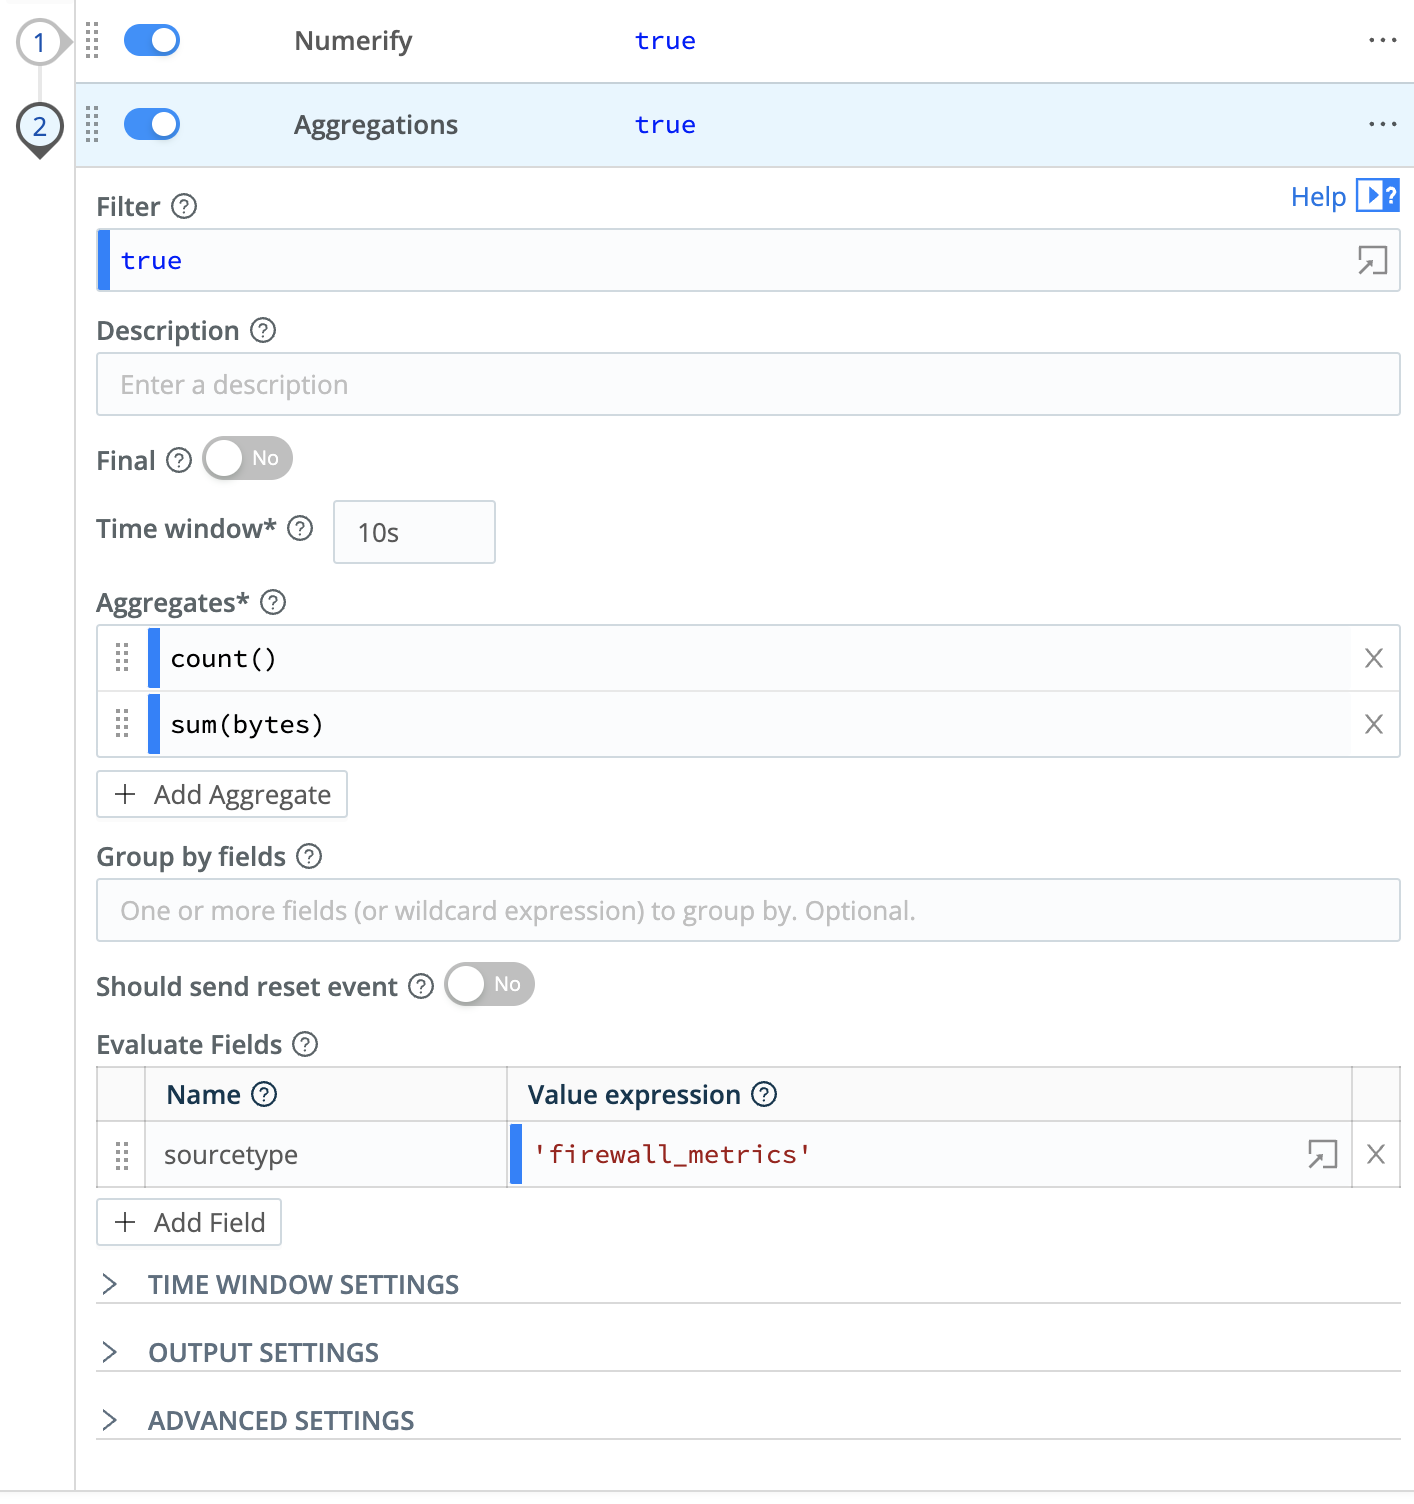
You should now also see the new sourcetype field show up in the aggregated events at right.