Viewing the Results
Now that we've created the Pipeline that will generate our metrics, we need to change the collector such that it uses the new Pipeline instead of the passthru Pipeline.
- Click the
Criblupper tab to go back to Stream. - With
Manageactive in Stream's top nav, selectDataand clickSources. - Click on
S3in theCollectorssection. - Expand the
pan-logscollector by clicking on it. - In the
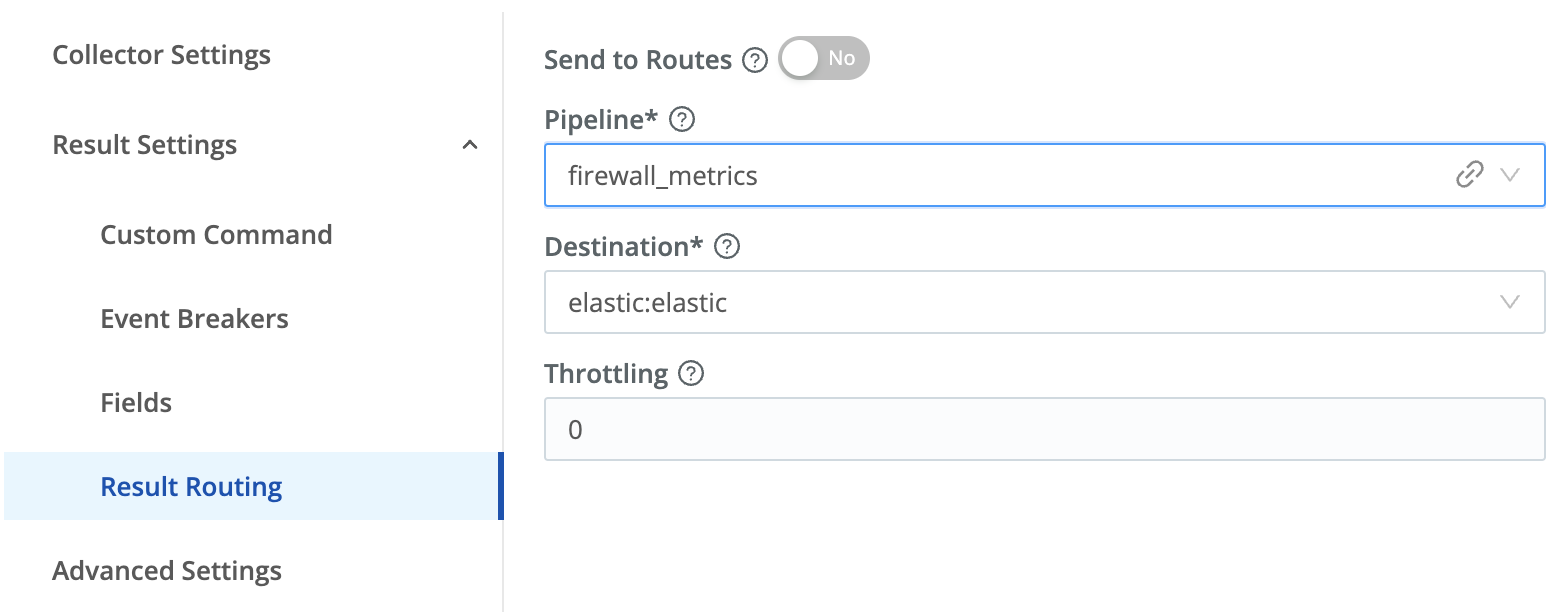
Result Settings>Result Routingsection, change thePipelinefield to usefirewall_metrics, and clickSave.
That section should now look like this:
Now all that's left is to run the collector job and look at our results. In this case, unlike our earlier job, we actually want to collect all of the data in the archive bucket.
- Click the
Runbutton next to your collector, and theRun configurationmodal will appear. - Click the
Full Runselection, leave everything else as the default, and clickRun. The modal should look like this: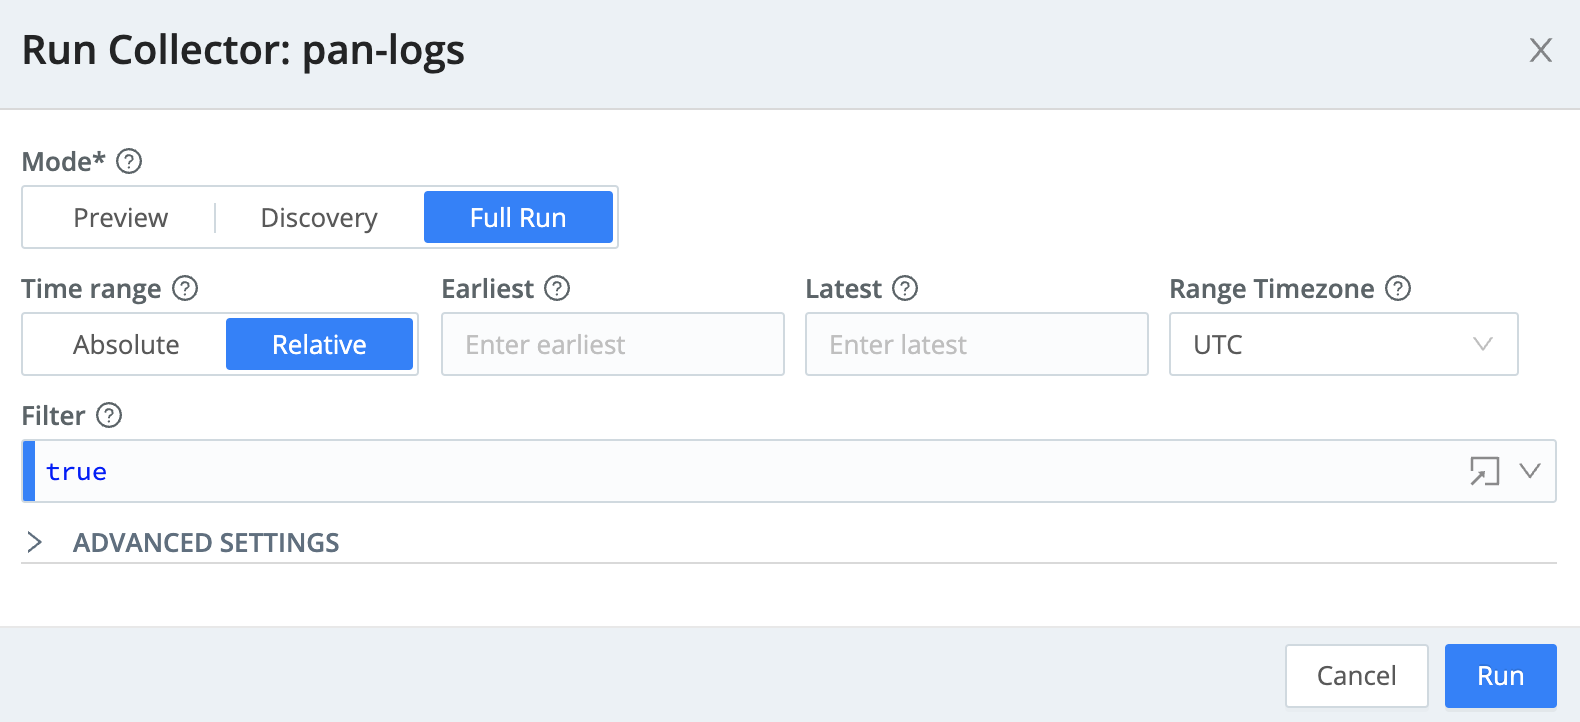
If you click Stream's Monitoring tab, hover over the System menu, and then click Jobs in resulting submenu, you can monitor the the data collection, like this:
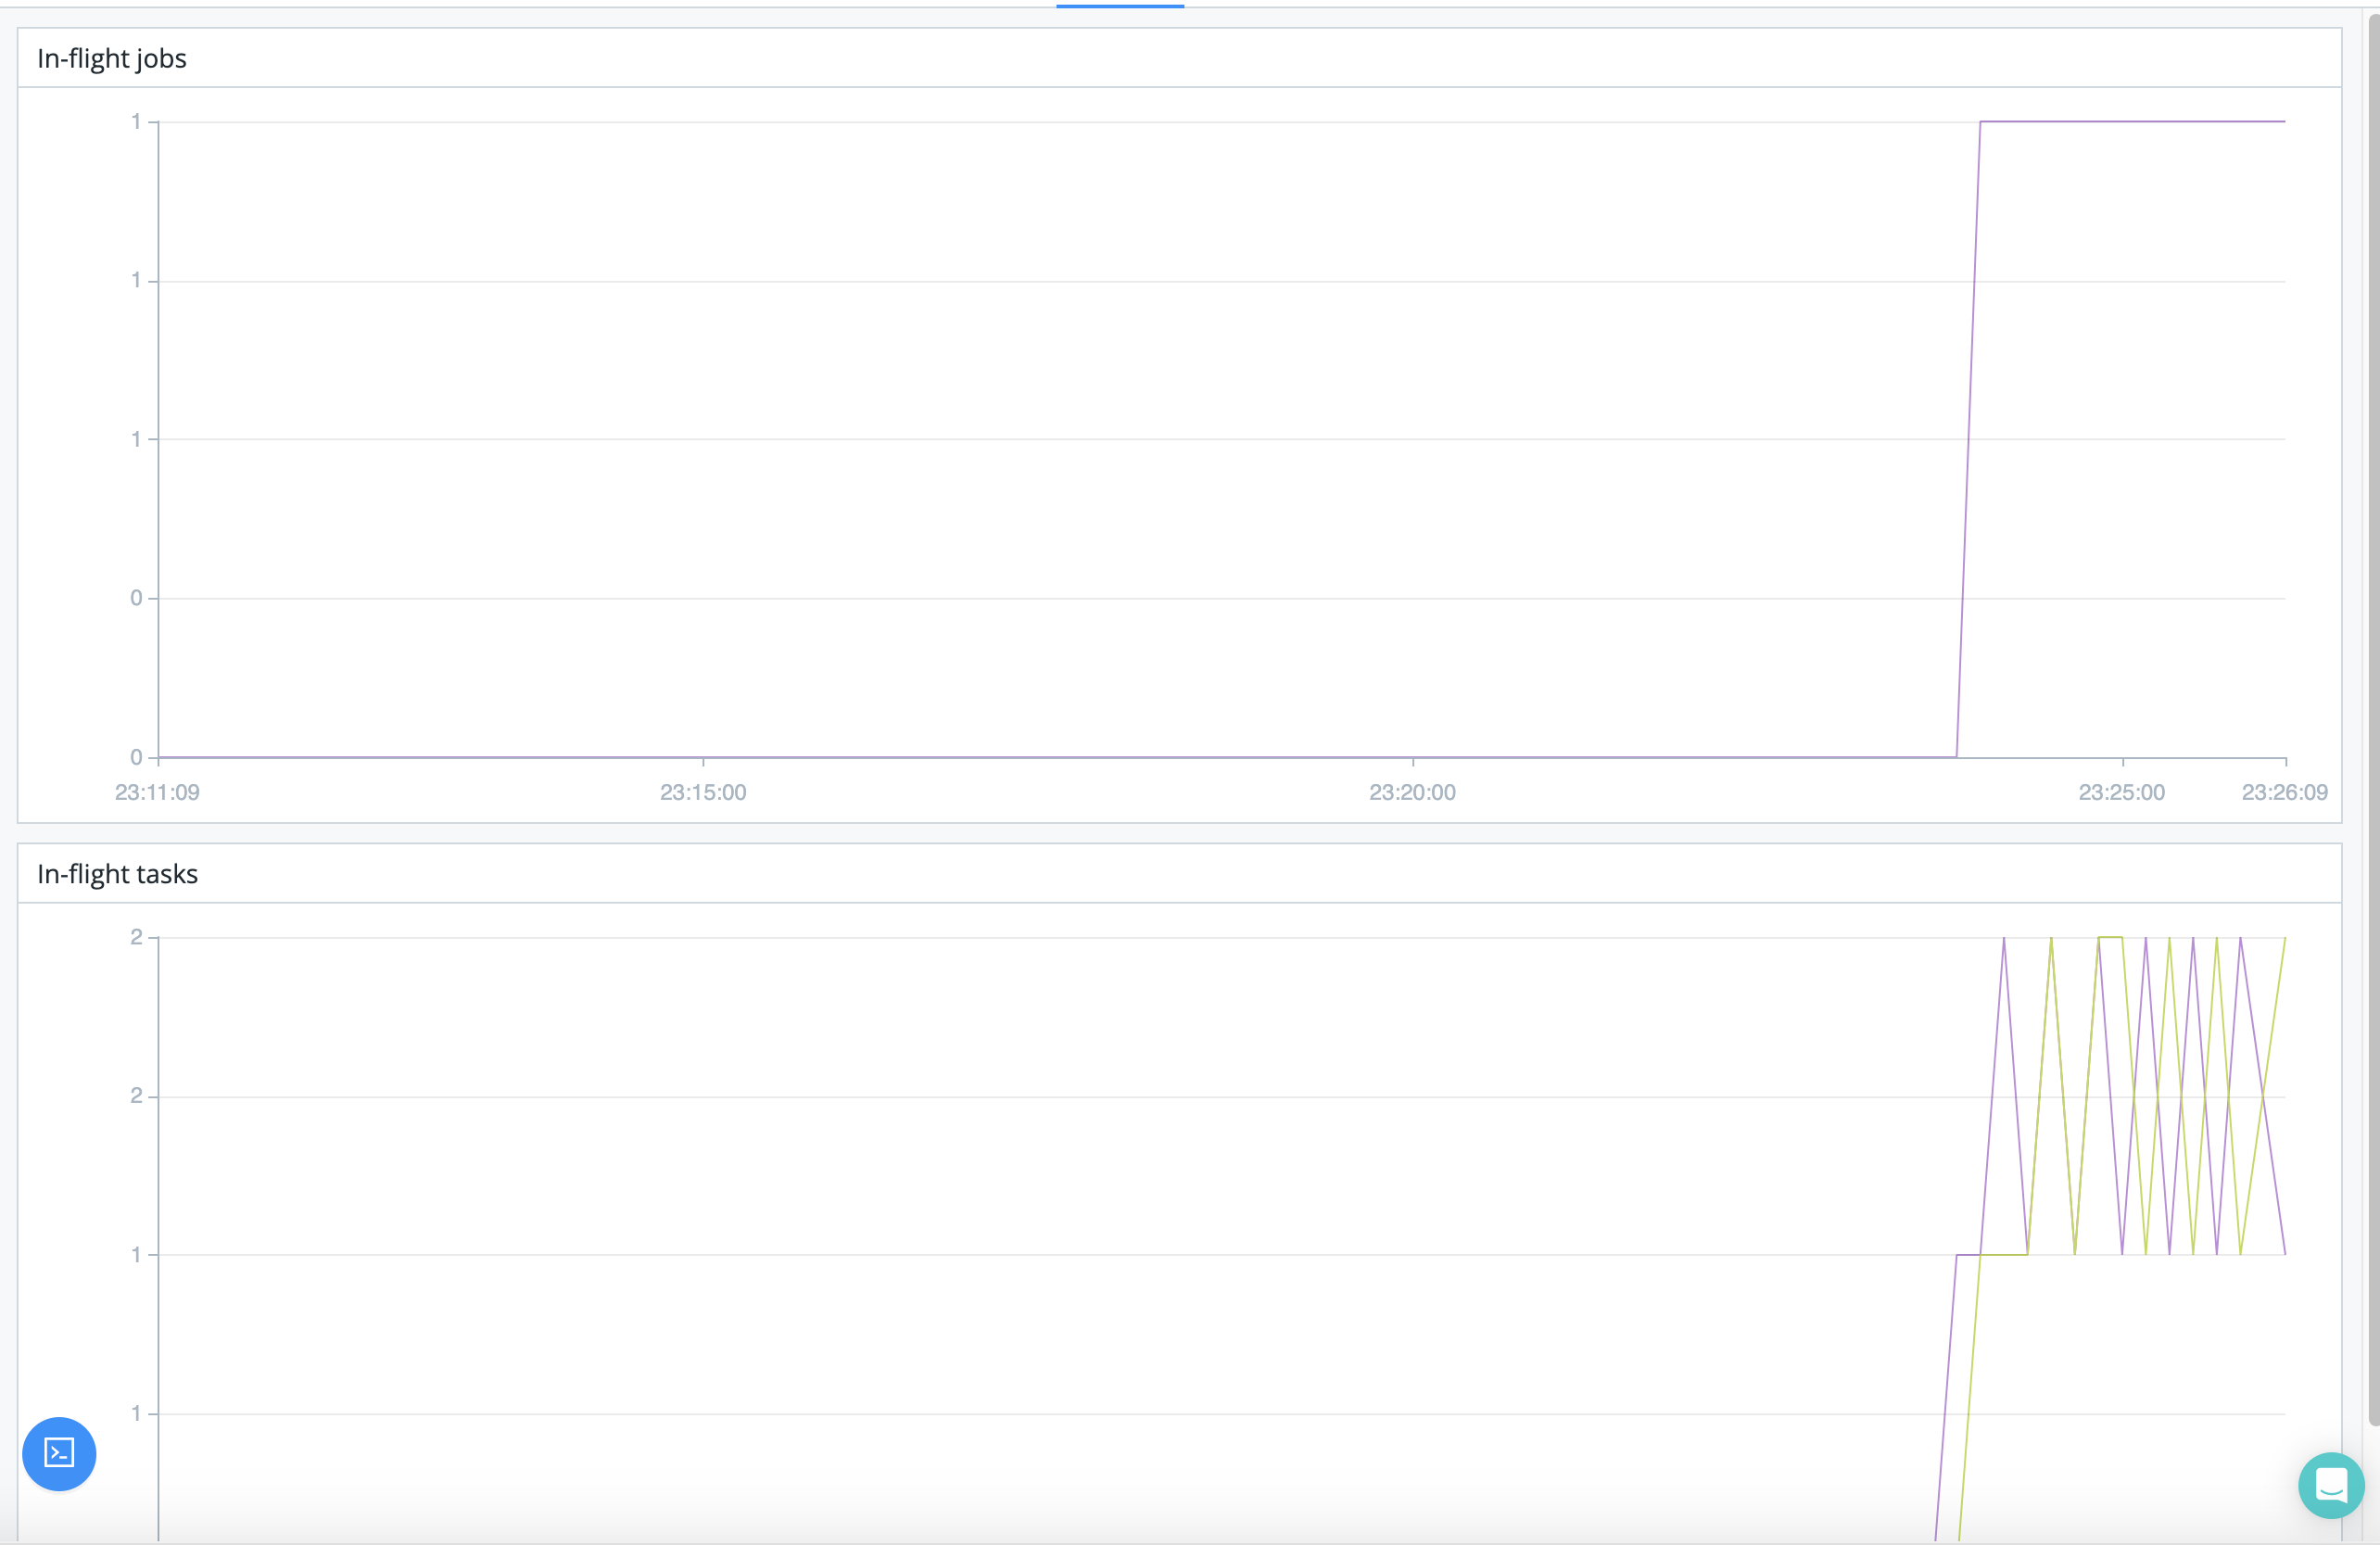
The full job is likely to take about 15 minutes to run, but you can see results after a couple minutes. Here's how:
- Click the
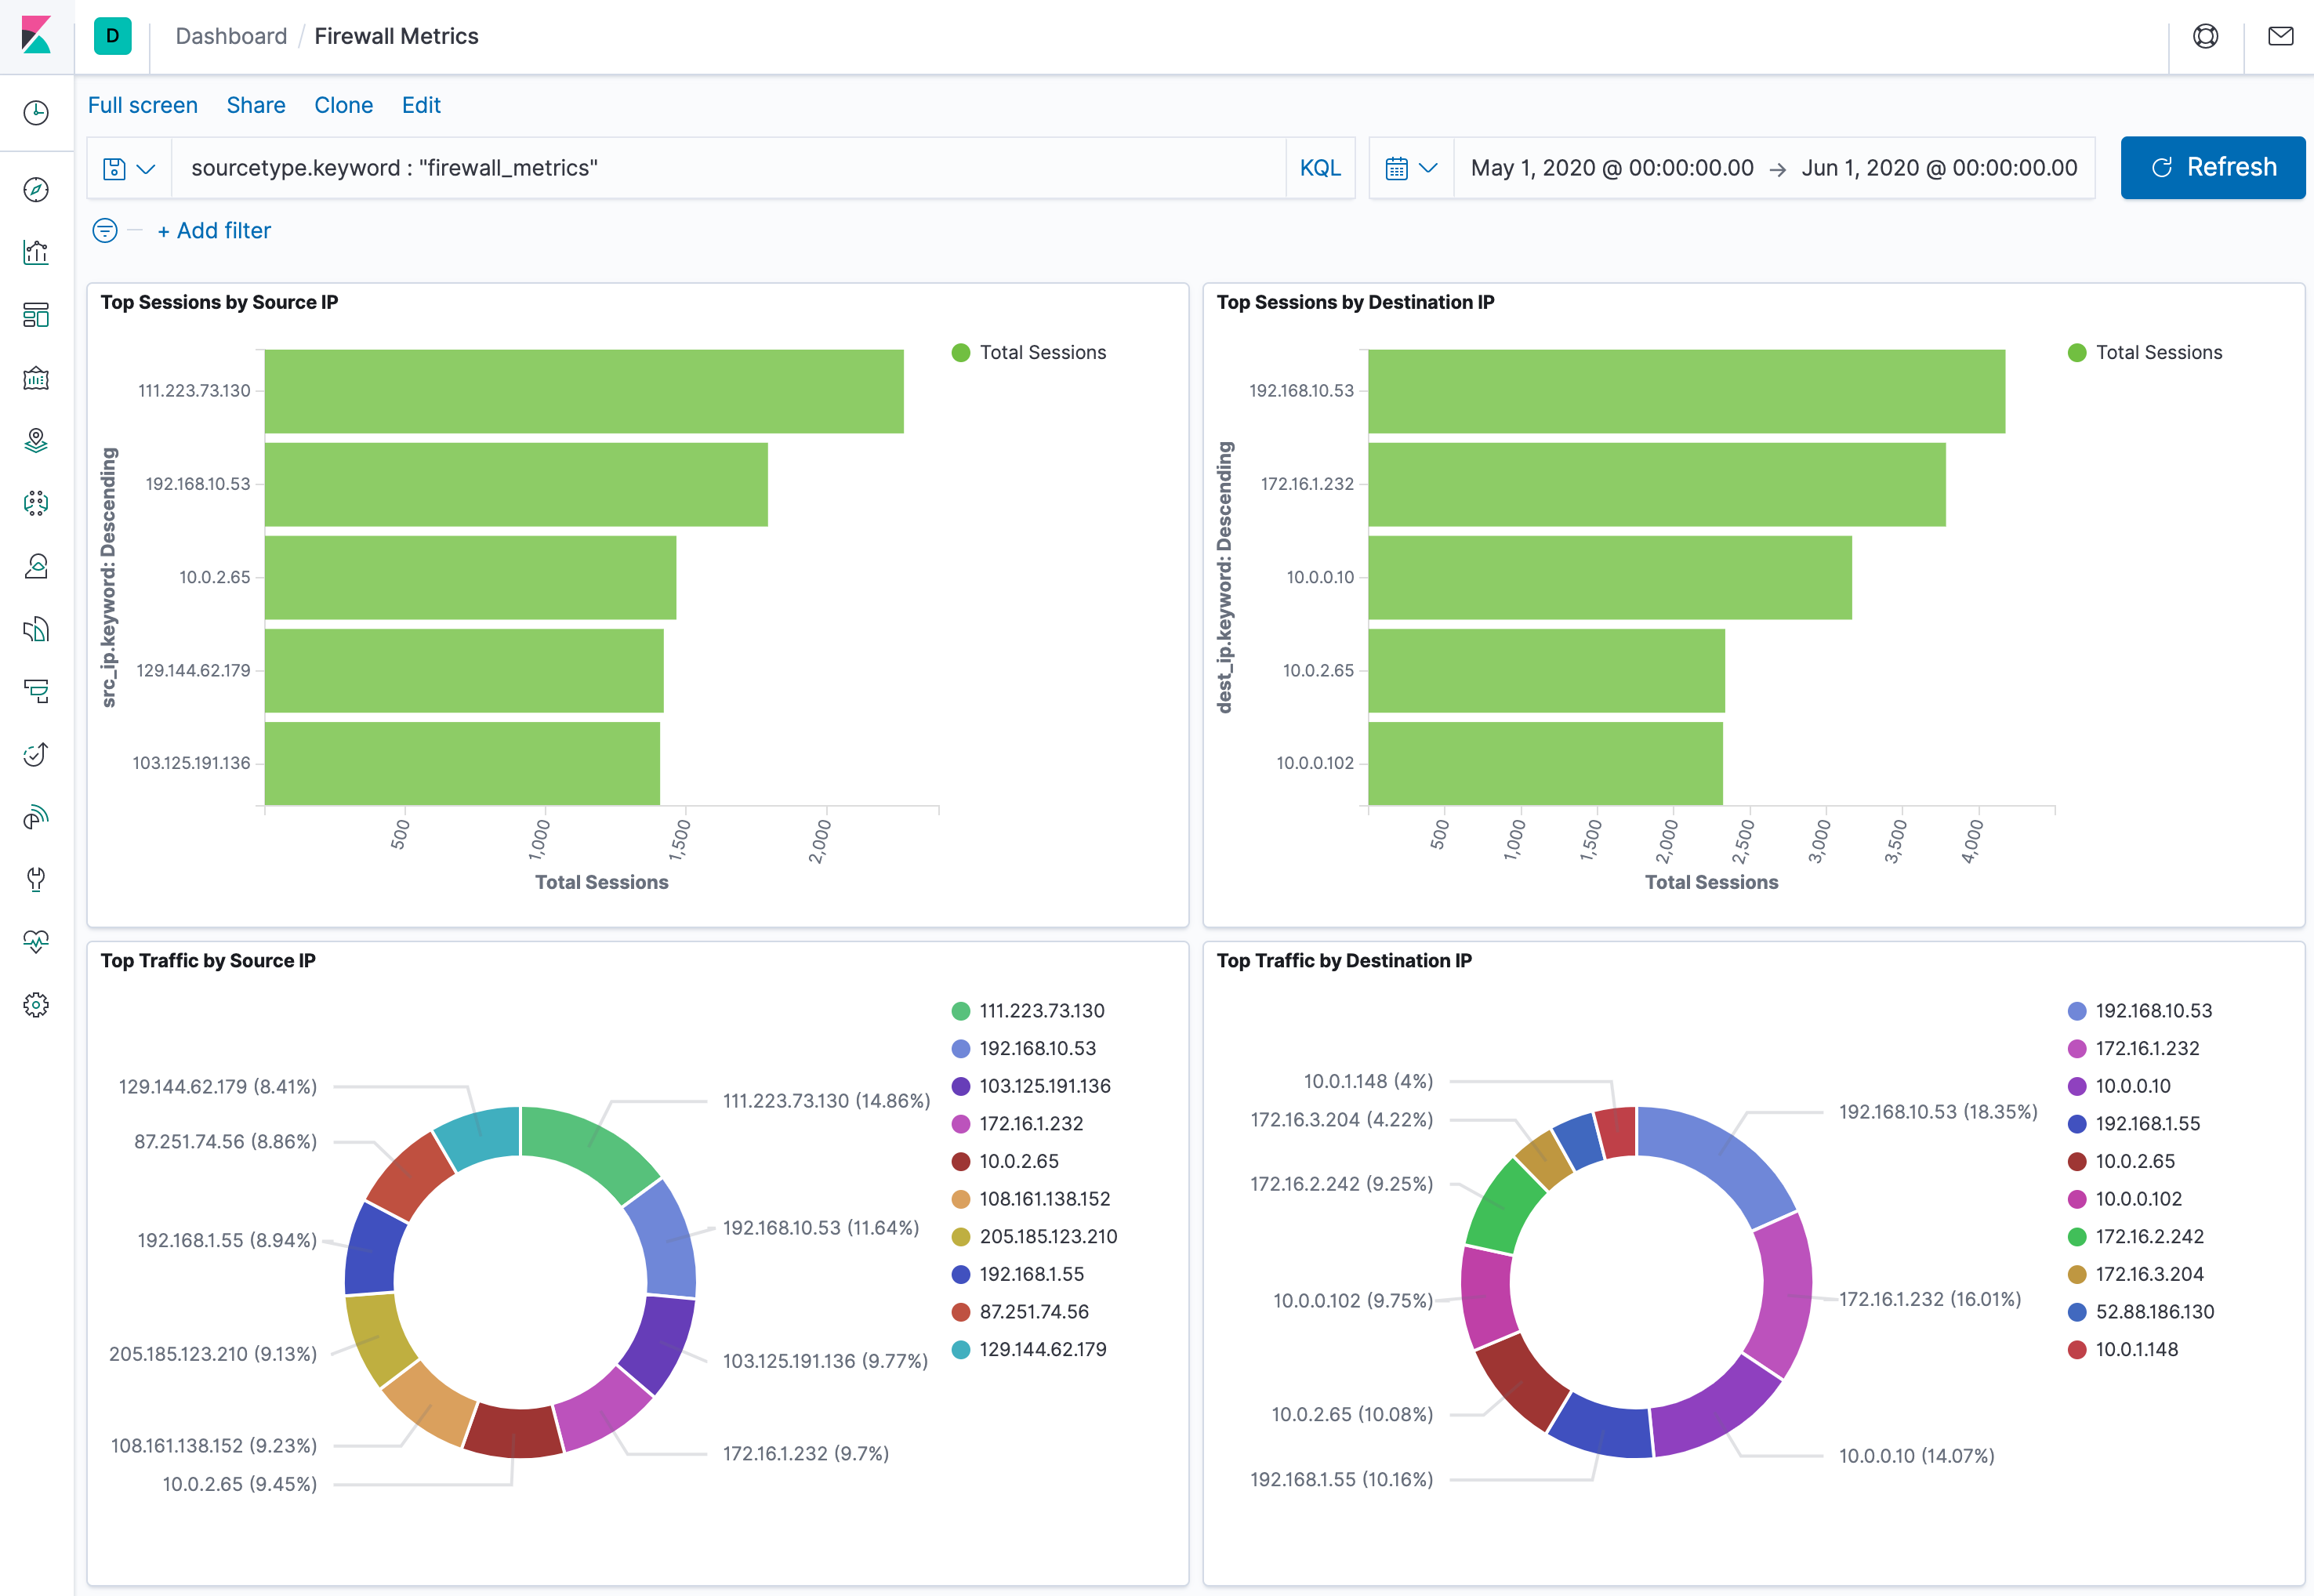
Kibana - Dashboardupper tab. - On the Dashboard, click the
Refreshbutton.
Once the screen has refreshed, the visualizations should now have data in them, and look something like this: