The Pipeline
Now we're ready to start using a few of Cribl Stream's built-in Functions to enrich this data.
A Quick Tour of Pipelines
First, let's show you around the Pipelines interface. Each Pipeline is a collection of Functions that you can associate with a specified Route, Source, or Destination.
- From the last section, you should already have
Manage > Processing > Pipelinesselected, andPreview Simpleselected in the right pane. In this sandbox environment (only), the leftPipelinespane might look a little cluttered. - Drag pane and column selectors to the right, as needed, to reveal the
Pipelinecolumn's contents in the left pane. Your interface should now look something like this (click to enlarge):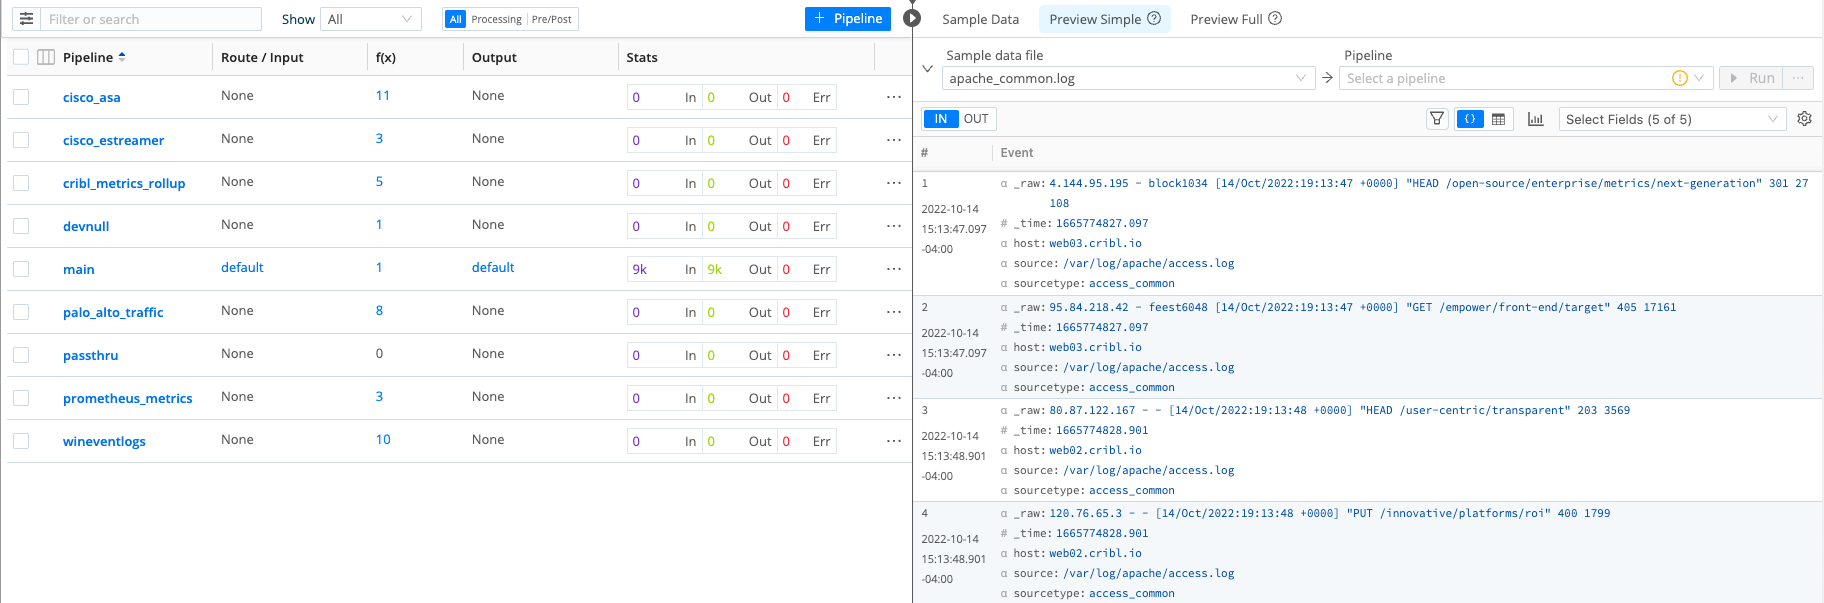
Pipelines
The Pipelines page lists all available Pipelines. You can search them or filter them based on their associations. Processing Pipelines are associated with Data Routes; pre-processing Pipelines are associated with Sources; and post-processing Pipelines are associated with Destinations. (Those associations are configured in the Data Routes, Sources, and Destinations interfaces, respectively.) You can also use the Show drop-down to filter by status: All, In Use, or Not In Use.
Preview
The right pane's Preview interface enables you to manipulate sample data. You can use this interface to see the results of the changes you make to a Pipeline before you commit those changes to live streams of data.
On the right pane's Sample Data tab, we've already used the Capture Data button. In other parts of this tutorial, we will experiment with the Paste [clipboard data] and Attach [sample file] options. For now, we will work with the sample we captured in the last step.
- If the right pane's
Sample Datatab doesn't have focus, click it. - Click the
Simplelink next to theapache_common.logfile. - Click any Pipeline in the left pane.
- To see how the selected Pipeline affects sample data, you can toggle between the
INandOUTbuttons at the top of the Preview pane'sPreview Simpletab. But we're about to make theOUTview more interesting, by creating a new Pipeline and then populating it with some Functions to refine our data.
Create a New Pipeline
Now that you're familiar with the interface, let's create our first Pipeline. For this Pipeline, we will add three Functions:
- The
Regex ExtractFunction, to extract the status code (and some other fields) from each event. - The
LookupFunction, to associate that status code with the correct description and type. - The
SampleFunction, to sample a subset of events of typeSuccesful, to reduce overall data volume.
- If the
Manage > Processing > Pipelinespage dosn't have focus, select theProcessingsubmenu and clickPipelines. - Click
Add Pipelinein the left pane's top-right corner, and then clickCreate Pipeline. - In the
IDfield, enteraccess_common_lookup. - Click
Save. You've created an empty Pipeline, which we'll now populate with Functions. - Click
Add Functionat the upper right, click theStandardsubmenu, and then click to selectRegex Extract. (You can also select a Function by typing the first few letters of its name into the drop-down's Search box.) Once you have selectedRegex Extract, it will appear in your Pipeline. - In the
Regex ExtractFunction, paste the following string into theRegexfield:^(?<__clientIP>[\d.]+) (?<__ident>\S+) (?<__httpBasicUser>\S+) (?<__timestamp>\[[^\]]+\]) "(?<method>\w+) (?<uri>[^?]+)\" (?<status>\d{3}) (?<bytes>\d+) - If
Source Fielddoes not already contain_raw, type that in. Your interface should now look like this (click to enlarge):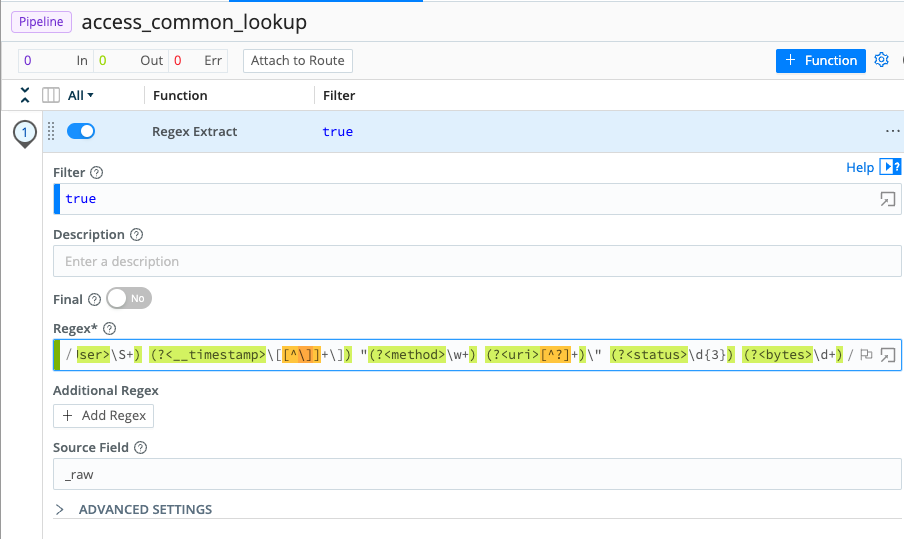
- Click
Save. - Confirm these changes in the Preview by toggling between
INandOUT. When viewingOUT, you should see the new fields that have been created by theRegex ExtractFunction highlighted in green.
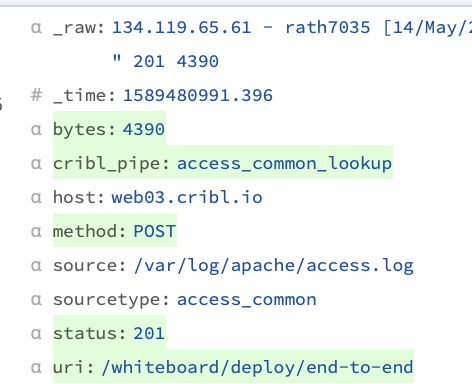 You can also toggle between the Event and Table buttons shown below, to confirm (for example) that the
 statusfield has been extracted properly in every event.
Now that we've reviewed the Pipelines interface and started our first Pipeline, let's enrich this data with a lookup.