The Lookup
At long last, we're ready to configure the lookup. First, let's create the Lookup table we'd like to use.
For this next portion you will need a CSV file. Download the CSV of status codes here: HTTP Status Codes. The CSV will be downloaded to the default location configured for your browser. This is usually your Downloads folder.
Add the Lookup Table
-
With
Manageactive in Stream's top nav, select theProcessingsubmenu then clickKnowledge.Note: Depending on the size of your window, the top nav will consolidate items that won't fit in a pulldown represented by an ellipsis (
...) - if so, click on the ellipsis and then selectProcessingand click onKnowledge. -
If
Lookupsis not already selected in the left sidebar, click to select it. -
At the upper right, click
Add Lookup File. This will allow you to create a lookup in one of two ways (choose whichever you prefer):Method 1: Upload a File- Select
Upload a New File. - Navigate to the
HTTP Status CodesCSV file that you've downloaded, then select it and clickOpen. - Type or paste
http_status_codes.csvinto theFilenamefield. - Click
Save.
Method 2: Create within Stream- Select
Create with Text Editor. - Open the
HTTP Status CodesCSV file that you've downloaded, then select all the text, up to the last character, and copy it to your clipboard. - Back in Stream's
Add Lookup Filemodal, paste the clipboard contents into the large text field. - Type or paste
http_status_codes.csvinto theFilenamefield. Your interface should now look like this (click to enlarge):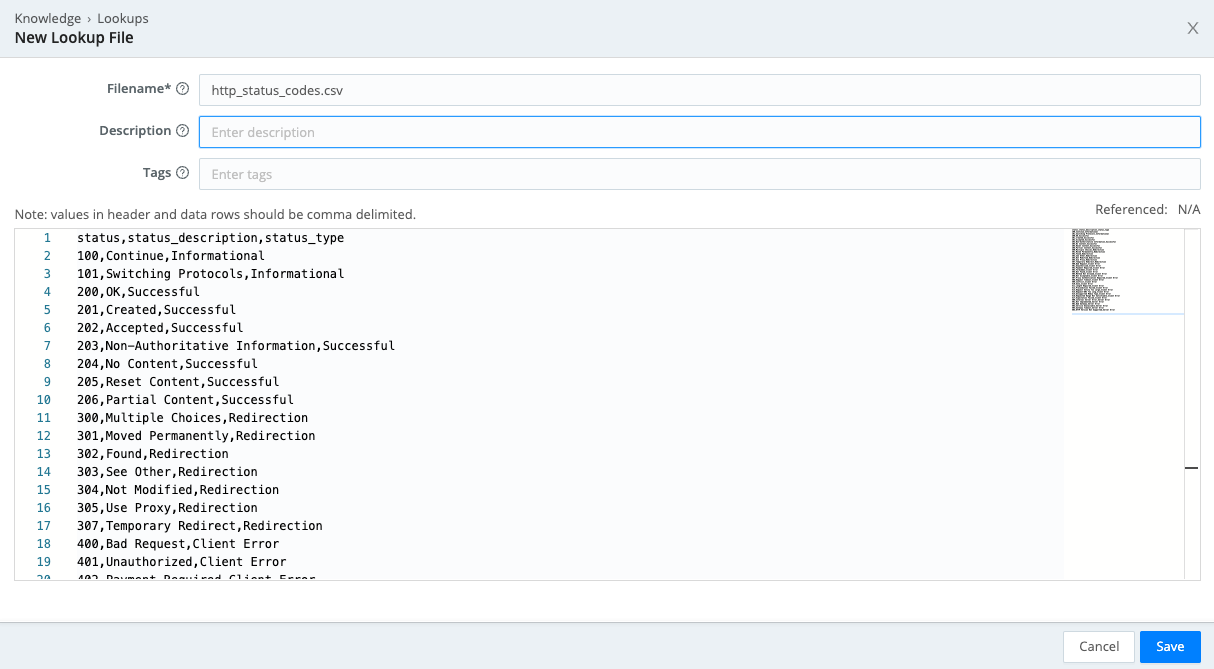
- Click
Save.
- Select
View the Lookup in the Terminal
In Stream, Lookup tables are simple CSV-formatted files that can be modified through Stream or through other scripts and programs. This flexibility enables a wide variety of use cases. For example, a script could update a Lookup table, on a daily basis, with the 1,000 most commonly accessed websites. This way, events containing requests to those popular sites could be filtered out, dramatically reducing data volume while improving your ability to identify anomalies.
- If the terminal is not already open at the bottom right, display it.
- At the command prompt, type or paste:
ls -l /opt/cribl/data/lookups
You should see a list of this Stream instance's Lookup tables, including the one we just created.
- At the prompt, type or paste:
head /opt/cribl/data/lookups/http_status_codes.csv
You should see the first several lines of the Lookup table we just created.
Configure the Lookup
Now that the Lookup table is saved, we are ready to configure the Lookup Function.
- Select the
Processingsubmenu, then clickPipelines. - Choose the
access_common_lookupPipeline from the list of Pipelines on the left. - As before, in the right
Sample Datapane, clickSimplenext to theapache_commonsample. Your interface should look like this (click to enlarge):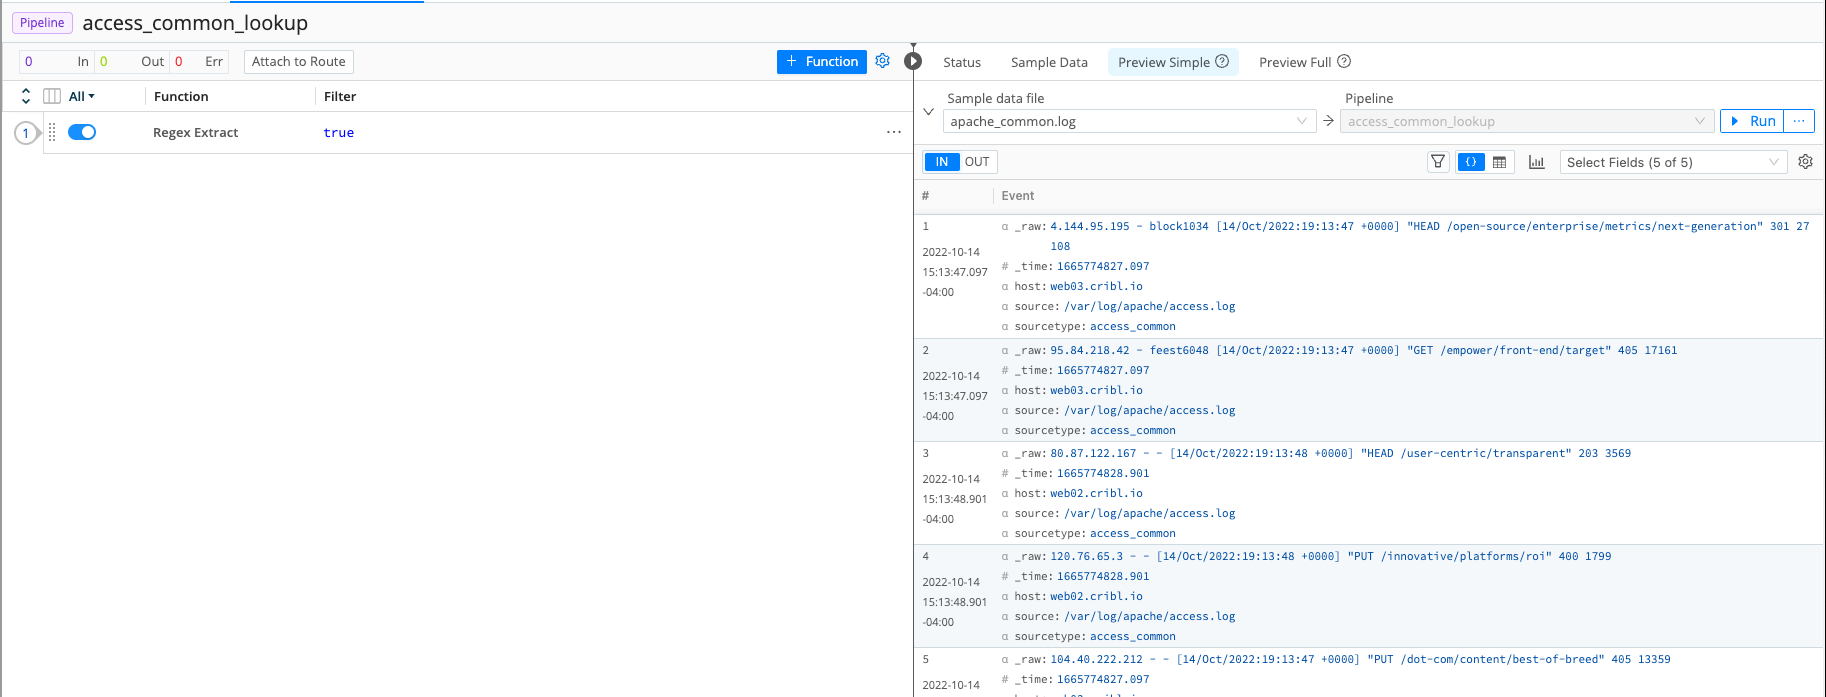
- To add the Lookup Function, click
Add Function, thenStandard, thenLookup.
Be sure to selectLookup, notDNS Lookup. - Configure the new Function's
Lookup file path,Lookup field(s), andOutput field(s)to match this screenshot (click to enlarge). Use the+Add field(s)buttons as needed: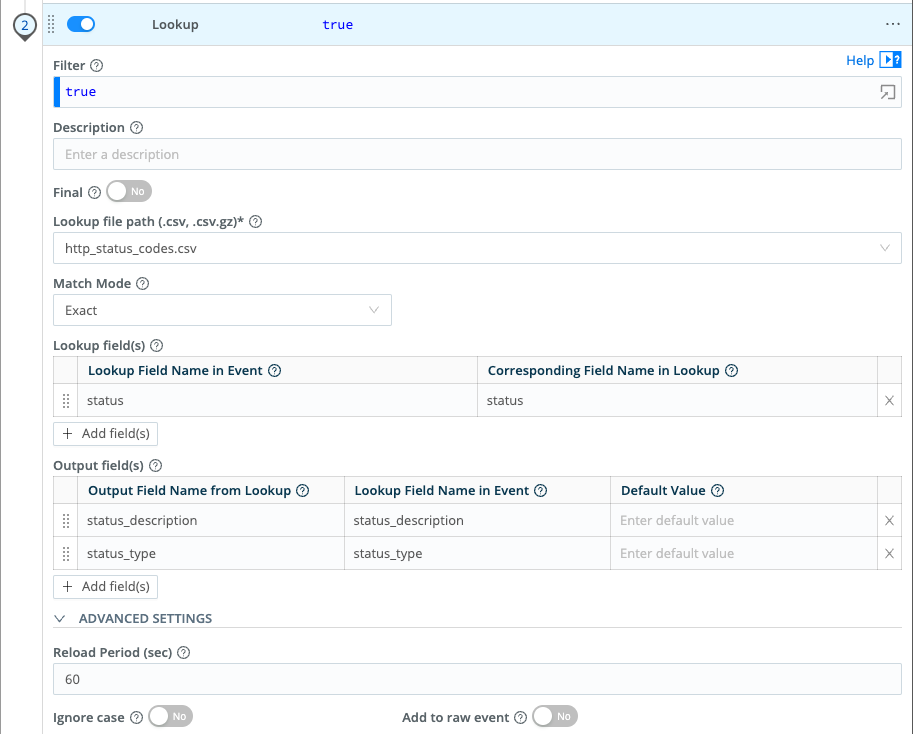
- Click
Save. - In the right Preview pane, toggle between
INandOUT. When selectingOUT, you should see the lookup values added to each event.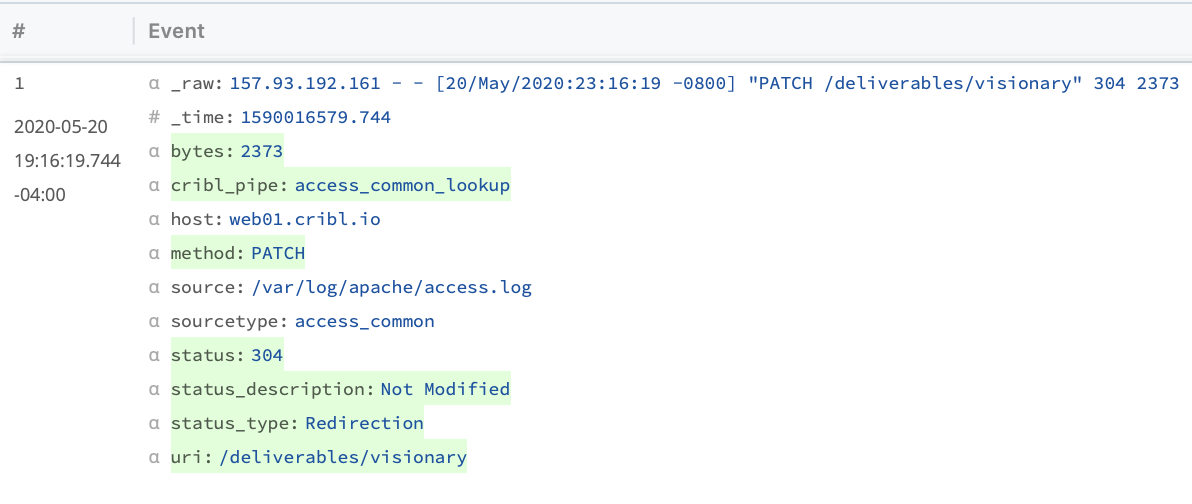
Configure Sampling
Finally, for the payoff: Let's sample events that are of type Successful, in order to reduce indexed volume without reducing your ability to identify anomalies.
Skip these steps if you're continuing from the preceding steps:
- Select the
Processingsubmenu, then clickPipelines. - Choose the
access_common_lookupPipeline from the list of Pipelines on the left. - As before, click
Simplenext to theapache_common.logsample on the right. Your interface should look like this (click to enlarge):
- To add the Sample Function, click
Add Function, thenStandard, thenSampling. - Configure the new
SamplingFunction to match this screenshot (click to enlarge). This sets up a 20% sampling rate for events of typeSuccessful: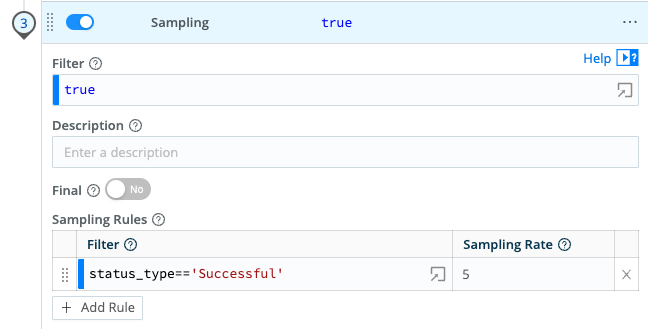
- Click
Save. - In the right Preview pane, toggle between
INandOUT. When selectingOUT, you should see that some events are faded and crossed out. Stream will omit those events when sending to destinations. - Finally, in the Preview pane, click on the Pipeline Diagnostics icon ()
Note: If your particular data sample didn't include events of type
Successful, you will see no events faded and crossed out. You can remedy this by taking another sample of the data.