Create Splunk Source
Next, we're going to configure a Splunk Universal Forwarder (UF) to send data to Cribl Stream. The UF is already installed, but not yet configured. To keep it simple, we're going to have it send only its internal logs, and the Cribl log directory, to have some examples of JSON logging.
Add a Splunk Source
- With
Manageactive in Stream's top nav, select theDatasubmenu and clickSources. - Click the
Splunk TCPtile. - There is a default disabled source called
in_splunk_tcp- Toggle theEnabledslider toYes. - Click
Yeson the dialog that pops up asking if you're sure you want to enable the input.
We now have a running Splunk input to Cribl Stream! Stream will be listening on port 9997 for traffic from a Splunk Universal Forwarder. For the sake of simplicity, we already have the Universal Forwarder installed, we just need to configure it to talk to Stream.
Start and Verify the Splunk UF
-
First, start the UF. Copy and paste the line below into the terminal:
/opt/splunk/bin/splunk start --seed-passwd cribldemo -
When prompted to accept the license agreement, enter
y. -
Once the UF has started, we need to add a
sandboxdirectory and tell it to monitor the Cribl log directory. Copy the lines below and paste them into the terminal:mkdir /sandbox/opt/splunk/bin/splunk add monitor /opt/cribl/config-volume/log -auth admin:cribldemo -sourcetype cribl -index cribl -
Next, configure the UF to send data to Stream. Copy and paste this command:
/opt/splunk/bin/splunk add forward-server uf-to-s3:9997 -auth admin:cribldemo -
Click
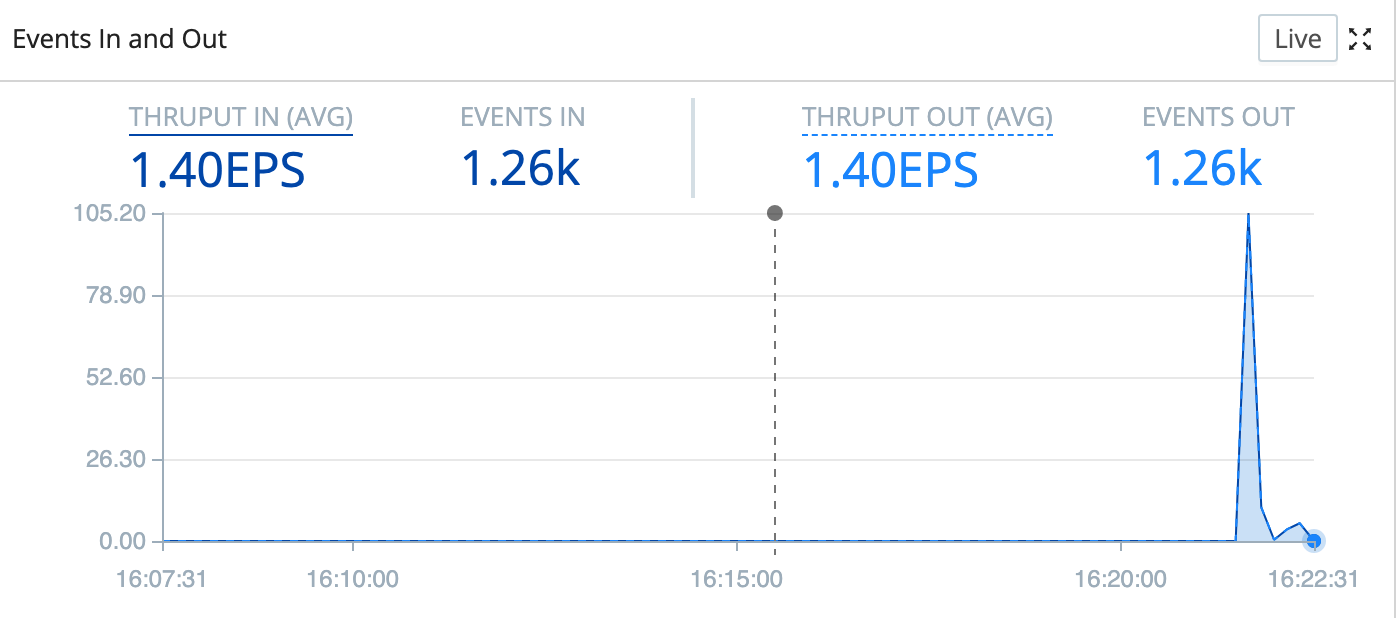
Monitoringin the top nav to verify the Splunk input.
After 30–60 seconds, you should notice a spike of new events coming in. The UF will clear its backlog of events pretty quickly, and then you'll see a more regular pattern of incoming events. It should look something like this:
Now that events are flowing, let's validate that MinIO is placing them in our filesystem. As mentioned earlier, MinIO is configured to write to the /data directory, so our files will be in a path that looks like: /data/logarchives/prefix/<timestamp>/<host>/<sourcetype>. Let's validate that we're seeing the proper data:
- Setup the Minio connection by running the following command:
mc alias set minio http://minio:9000/ ACCESSKEY SECRETKEY - Validate that files are showing up by using the MinIO client to run the following
findcommand in the terminal. You should see a number of files with the patternCriblOut-<id>.json:mc find minio/logarchives -name '*.json' - Check the files' contents, to validate that metrics data is flowing from Splunk's internal logs:
mc find minio/logarchives -name '*.json' -exec "mc cat {}" | jq -r ._raw | egrep "INFO.*Metrics"
Success! Now we've got data flowing from Splunk's Universal Forwarder to Cribl, and then on through MinIO to the filesystem. Next, we're going to show how to parse, reshape, and enrich this data.