Enrich Data
Now, we're going to enrich events with information from a CSV file we have in Stream. This is the simplest form of enrichment, but Stream can also enrich against nearly any source, by using custom Functions.
First, we're going to examine our lookup file.
Examine Lookup
-
In the top nav, make sure
Manageis active, then select theProcessingsubmenu and clickKnowledge.Note: Depending on the size of your window, the top nav will consolidate items that won't fit in a pulldown represented by an ellipsis (
...) - if so, click on the ellipsis and then selectProcessingand click onKnowledge. -
Click
Lookupson the left. -
Click
essential.csvto open its editor modal. -
Beside
Edit Mode, theTableshould be selected.
You're now looking at a simple CSV file, displayed as a table. In this CSV, we have 2 columns. We're going to look up the group field in metrics.log against this CSV, returning an __essential field.
__essential is an internal field in Stream, which won't be sent to the downstream systems, but Stream expressions can access it the same as any other field. This allows us to store a bit of state in the event that's used only in Cribl. Later, we can easily filter down to only the pipeline and queue groups, by looking for __essential to be true.
Now that we've seen the lookup table's structure, let's navigate back to Pipelines.
Navigate back to Pipelines
-
Click
Xat the top right, or pressEsc, to close the CSV editor modal. -
Select the
Processingsubmenu and clickPipelines. -
Minimize the right Preview pane, as necessary, to expand the left Preview pane.
-
Click in the search bar (top left) and type
splunk. -
Click the
splunk-metricsPipeline. -
Expand the right Preview pane
You can click the Expand button at the bottom right.
-
In the Preview pane's
Sampleslist, next tometrics.log, clickSimple. -
Click the
OUTtab near the Preview pane's top.
Now that we're back in the Pipeline editor, let's add our Lookup Function.
Add Lookup Function
- Click
Add Function. - Search for
Lookup, and click it.
(You wantLookup, notDNS Lookup.) - In
Filter, replace the defaulttruevalue with:splunk_metrics.group.
(This tests that thegroupfield is contained in thesplunk_metricsobject.) - Click in
Lookup file path, and select theessential.csvtable from the drop-down. - Under
Lookup Field Name in Event, enter:splunk_metrics.group. - Under
Corresponding Field Name in Lookup, enter:group. - Click
Save.
Let's explain a bit of what we're doing here. The Lookup Function will match only if a field in an object called splunk_metrics is present, and contains a member of group. This should evaluate true for all the events we're concerned with.
Next, we selected a lookup file that was already installed in the Knowledge section. This Lookup Function will look inside that file, to match a given row if the value from an event matches the column value.
Lookup Field Name in Event tells Stream which event field to grab the value from. Corresponding Field Name in Lookup tells us what field to map to in the lookup file. With no Output field(s) currently configured, this Lookup Function will return all the rest of the columns from the lookup. (If you want to select a subset of columns, or to rename fields, add rows to the Output field(s) to do the mapping.)
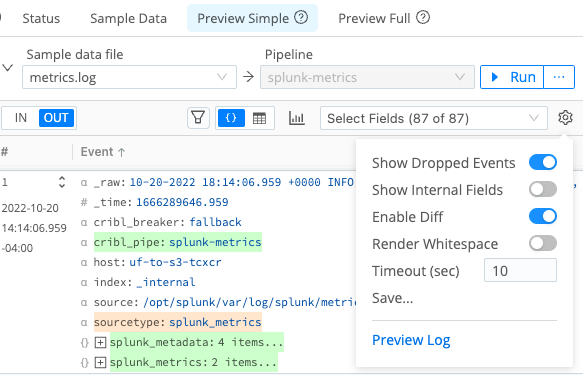
Now we've enriched our events! But since our new field, __essential, is an internal field, we need to set Stream to show internal fields.
Show Internal Fields
- In the right Preview pane, next to
Select Fields, click the gear button. - In the resulting
Advanced Settingsdrop-down, enableShow Internal Fields. (See below.) - Click the gear again to close the drop-down.

In the right Preview pane, you should now see __essential set to true or false for every event. Events with a group of pipeline or queue will be set to true.
This technique is a great way to manage lists of items you want to selectively process, without having to declare a lot of individual Functions with Filter conditions. For this use case, let's drop events which are not __essential, and see how much our dataset is reduced.
Add Drop Function
- Click
Add Function. - Search for
Drop, and click it. - Scroll down into the new
DropFunction, and click into itsFilterfield. - Replace the
Filterfield's defaulttruevalue with:!(__essential==='true') - Click
Save.
In the right Preview pane, you should notice that many events have been dropped. You can click the Pipeline Diagnostics button next to Select Fields (it looks like a small bar chart) to see how many events have been dropped. Depending on your capture, it may be nearly 100%. It should look something like this:

If you want to display only events that have not been filtered out, click the gear button next to Select Fields, and disable the Show Dropped Events slider.
Now that we've filtered down to just a subset of the data stream, let's install a Route to start outputting this modified data.