Parse Data
The data currently flowing through Stream is pretty standard log data, and shows a mix of real-world types. In this stream, there are JSON logs, key=value–type logs, and regular unstructured text logging.
If we're putting this data into a data lake for analysis, Cribl Stream can greatly help in parsing structured log formats and reformatting them as JSON for easier analysis. As part of this, we can also drop overly verbose fields – like the original _raw log field – and in the next step, enrich the data with additional context.
First, we're going to work with the Splunk Universal Forwarder's metrics.log, which contains structured metrics data output as a log. For now, we simply want to parse this and structure it. Then we'll use an Eval Function to reshape the data.
The first thing we need to do in Stream is create a new Pipeline we'll use to process the data. Pipelines are a series of Functions which work on the data linearly, as events pass through them. Functions operate on the data if their Filter Expression returns true. This filtering allows for great flexibility in how to process data conditionally. Let's add a new Pipeline.
Create a New Pipeline
- With
Manageactive, select theProcessingsubmenu, clickPipelines. - Drag right to minimize the right
Sample Datapane, so you can display more of thePipelinespage. - Click
Add Pipelinenear the top right. - Click
Create Pipelinefrom the resulting drop-down. - For the Pipeline's
ID, entersplunk-metrics. - Click
Save.
Now we have an empty Pipeline we can use to operate on the data. When working with this data, it helps to first start with a capture. This enables us to work with an offline sample to get data into the right shape before committing our configurations. Let's grab a sample of metrics.log.
Capture a Sample
- Expand the right
Sample Datapane. - At the right, click
Capture Data. - In the
Capture Sample Datamodal'sFilter Expressionfield, copy and paste the following expression to replace the defaulttruevalue. This uses the JavaScript.match()function, which can be called on any string, to look in the source field for sources ending inmetrics.log. (The$anchors the regular expression at the end of the string.)source.match(/metrics.log$/) - Click
Capture.... - For
Capture Time (sec), input100. This will keep the capture open 100 seconds instead of the default10seconds. - For
Capture Up to N Events, enter100. This will capture up to 100 events. - Click
Start. - Wait for the capture to complete (likely between 30-100 seconds, depending on how quickly 100 matched events arrive).
- Click
Save as Sample File. - In
File Name, replace the default entry withmetrics.log. - Click
Save.
Now, at the right, we have 100 events from Splunk's metrics.log. We can see in the _raw field the normal log line, along with Splunk's metadata like _time, host, index, source, and sourcetype. For this log, we want to parse _raw, lift the parsed fields up as fields in the event itself, and then drop _raw.
First, let's add a Parser Function to our Pipeline.
Add Parser Function
- Click
Add Functionat the top of the Pipelines pane. - Search for
Parserin the search box. - Click
Parserto add it to the Pipeline. - For
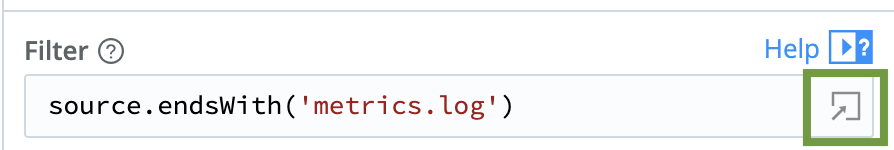
Filter, copy and paste the following over the defaulttruevalue. This is another string expression, using JavaScript'sendsWith()function on thesourcefield:source.endsWith('metrics.log') - Click the Expand button at the
Filterfield's right edge (see below), so that we can validate our expression.
Here is what the interactive Filter editor looks like:
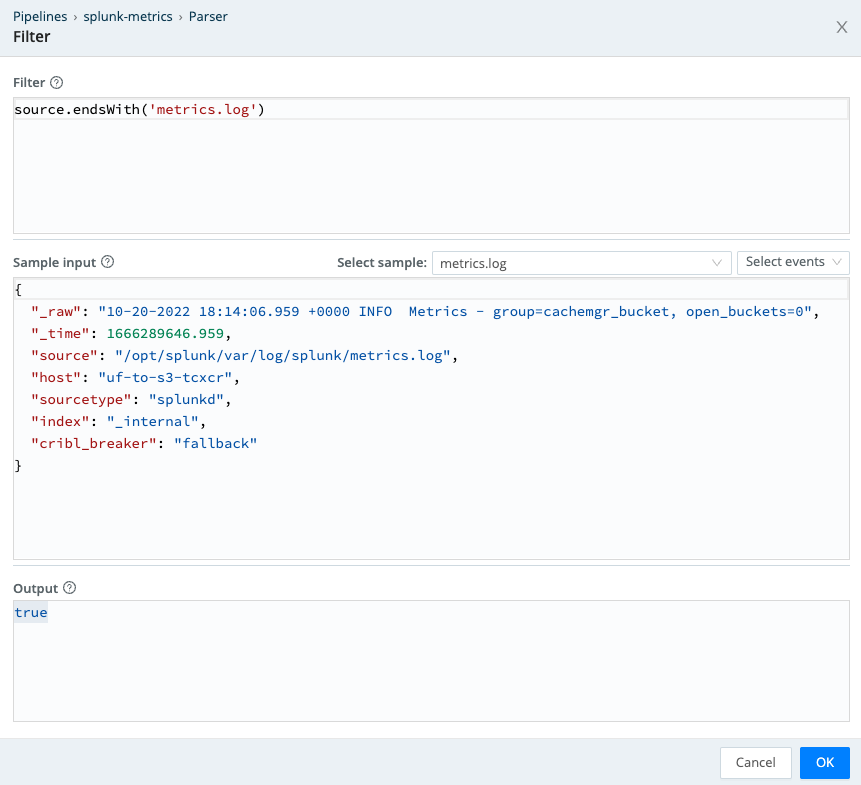
You can see that the Output field says true, meaning that our Filter matches against this event. This editor modal can be very helpful for validating your configurations.
Continue Adding Parser Function
- Click
OKto close theFiltereditor. - Back in the Parser Function's definition, set the middle
Typefield toKey=Value Pairs. - In
Destination Field, entersplunk_metrics. - Click
Saveto add the Parser Function to the Pipeline. - At the right Preview pane's top left, click
OUT.
Every time we modify our Pipeline, the Preview pane's OUT side will update to show the results. Right now, you can see a diff of the fields we've added as the Pipeline processes these events. Your Preview should look something like the example below, where we add a cribl_pipe field, and a splunk_metrics field with at least 2 or more items parsed out.
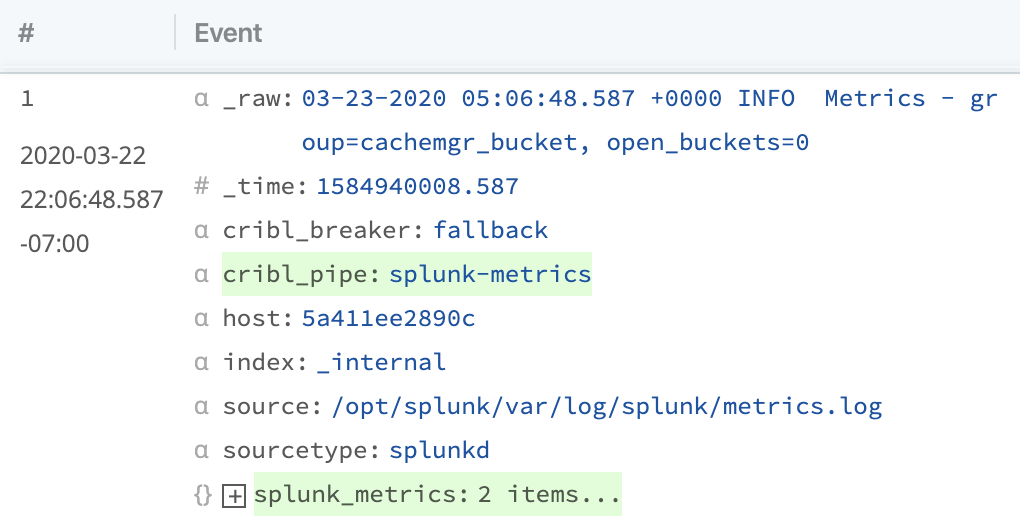
You can expand the splunk_metrics field to see its contents. It should contain all the key=value pairs that are in plaintext in _raw above. With the Parser Function's Key=Value setting, Cribl Stream is smart about finding key=value pairs inside of raw logs. This makes it easy to convert from semi-structured log formats into more-structured formats like JSON.
Log data often comes in many weird formats, and Stream works with nested data structures easily. Next, we'll see how easy it is to reshape data in Stream.