Advanced Editing
You've done such a good job thus far that I think you're ready for some of the more advanced dashboard concepts.
Parent Searches
The best data jedi create dashboards that have a similar theme or concept to them. This just logically makes sense. Because of this, many of the panels in the dashboard may be slight derivatives of each other. To make dashboards more performant Cribl Search employs the concept of parent searches.
Parent Searches are queries that serve as a starting point for queries in other panels. The beauty of this is that instead of running the same query multiple times (once per panel) the parent search will be run once, then each panel can leverage the results of the parent search to visualize the data differently.
As you can imagine, when done correctly, this greatly reduces processing time. This approach also makes editing the dashboard easier. Instead of editing the query in each panel you can simply edit the parent search.
- While in
Editmode, click theAdddropdown. - Click
Visualization. - For the
TitleenterJobs. - In the
query boxenter:dataset="$vt_jobs"
| project _time, id, dataset=resolvedDatasets, query, status, timeStarted, timeCompleted, type - Click
Search. - Change
TypetoEvents. - Check the
Hide this Panelbox. - For
Time range inputselectTime Range. - Click
Apply. - Close the
Editmodal. - Click
Save.
The visualization that we just created will serve as our parent search. Notice that because we chose to hide the panel you now have a dropdown at the top of the dashboard titled Hidden Panels. This is where can can view and edit any hidden panels that we have added to the dashboard.
Now we'll create a new panel that leverages our parent search.
- While in
Editmode, click theAdddropdown. - Click
Visualization. - For the
TitleenterAvg Search Runtime. - For Parent Search select Jobs.
note
You will notice that any search in our
dashboard(hidden or visible) can be used as aparent searchfor anotherpanel. - In the
query boxafter thepre-populated textenter:| where status == "completed"
| extend startTime = unixtime_milliseconds_todatetime(timeStarted),
endTime = unixtime_milliseconds_todatetime(timeCompleted),
duration = endTime - startTime
| summarize avg_dur_sec = round(avg(duration), 2) - Click
Search. - Change
TypetoGauge. - Enable the
Apply Thresholdtoggle. - Close the
Editmodal. - Click
Save.
Just like that we now have a panel that uses a parent search as it's starting point. Keep in mind that since our parent search is using our time range input, the Avg Search Runtime panel is also reliant on that time range input.
JSON Editing
Hopefully you are finally recognizing the full power of The force Cribl Search. If not then you will shortly. We've seen how dashboards can become dynamic, now let's take a gander at how dashboards can interact with other dashboards. First we need another dashboard to interact with. The only problem is we just built one and quite frankly I don't feel like building another. This is a great time to show you JSON Editing.
Dashboards have an advanced JSON Editing mode. In this mode you can edit the entire dashboard including visualizations, searches, and inputs without the UI clicks. This is also a great way to import and export whole dashboards. Allow me to demonstrate.
Importing Dashboards
- In the left navigation bar click
Dashboards .
. - Click
Add Dashboard. - For
NameenterSBX Interaction Dashboard. - For
CollectionselectSandboxes. - Click
Save. - Click the
dashboard options icon at the top right of the page.
 - Click
Edit as JSON.
If this were a dashboard that had panels then we could use the Export button to save the entire JSON to a file. Instead we are going to Import one.
Use this link to download the SBX Interactive Dashboard JSON file.
Can't download the file?
Replace the contents of the JSON Editor with the below JSON snippet.
{
  "elements": [
    {
      "horizontalChart": false,
      "config": {
        "horizontalChart": false
      },
      "id": "ruuvyzy19",
      "inputId": "dataset",
      "type": "input.text",
      "layout": {
        "x": 0,
        "y": 0,
        "w": 2,
        "h": 2
      },
      "title": "Dataset"
    },
    {
      "horizontalChart": false,
      "config": {
        "onClickAction": {
          "type": "None"
        },
        "showRowNumbers": false,
        "colorPalette": 0,
        "colorPaletteReversed": false,
        "customData": {
          "trellis": false,
          "connectNulls": "Leave gaps",
          "stack": false,
          "dataFields": [
            "dataset",
            "_raw",
            "source",
            "time",
            "cid",
            "channel",
            "level",
            "message",
            "serviceId",
            "blockedSince",
            "openFiles",
            "closingFiles",
            "activelyClosing",
            "_time",
            "datatype"
          ]
        },
        "xAxis": {
          "labelOrientation": 0,
          "position": "Bottom"
        },
        "yAxis": {
          "position": "Left",
          "scale": "Linear",
          "splitLine": true
        },
        "legend": {
          "position": "Right",
          "truncate": true
        },
        "horizontalChart": false,
        "timestats": false
      },
      "search": {
        "type": "inline",
        "query": "dataset in($dataset$) | limit 10000",
        "earliest": "-1h",
        "latest": "now",
        "sampleRate": 0.01
      },
      "id": "436ut3460",
      "layout": {
        "x": 0,
        "y": 0,
        "w": 4,
        "h": 2
      },
      "type": "list.events",
      "title": "Log Data",
      "hidePanel": true
    },
    {
      "horizontalChart": false,
      "config": {
        "onClickAction": {
          "type": "None"
        },
        "style": true,
        "applyThreshold": false,
        "colorThresholds": {
          "thresholds": [
            {
              "color": "#45850B",
              "threshold": 30
            },
            {
              "color": "#EFDB23",
              "threshold": 70
            },
            {
              "color": "#B20000",
              "threshold": 100
            }
          ]
        },
        "colorPalette": 0,
        "colorPaletteReversed": false,
        "customData": {
          "summarizeOthers": false,
          "trellis": false,
          "connectNulls": "Leave gaps",
          "stack": false,
          "dataFields": [
            "sources"
          ],
          "seriesCount": 1
        },
        "legend": {
          "position": "Right",
          "truncate": true
        },
        "xAxis": {
          "labelOrientation": 0,
          "position": "Bottom"
        },
        "yAxis": {
          "position": "Left",
          "scale": "Linear",
          "splitLine": true
        },
        "horizontalChart": false,
        "timestats": false,
        "color": "#2da8b9",
        "label": "Sources"
      },
      "search": {
        "type": "inline",
        "query": "| summarize sources = dcount(source)",
        "earliest": 0,
        "latest": "now"
      },
      "id": "tykfduwst",
      "layout": {
        "x": 0,
        "y": 0,
        "w": 6,
        "h": 4
      },
      "type": "counter.single",
      "title": "Unique Sources",
      "parentSearchId": "436ut3460"
    },
    {
      "horizontalChart": false,
      "config": {
        "colorPalette": 0,
        "colorPaletteReversed": false,
        "customData": {
          "summarizeOthers": false,
          "trellis": false,
          "connectNulls": "Leave gaps",
          "stack": true,
          "dataFields": [
            "datatype",
            "events"
          ],
          "seriesCount": 1
        },
        "legend": {
          "position": "Right",
          "truncate": true
        },
        "onClickAction": {
          "type": "None"
        },
        "xAxis": {
          "labelOrientation": 0,
          "position": "Bottom"
        },
        "yAxis": {
          "position": "Left",
          "scale": "Linear",
          "splitLine": true
        },
        "horizontalChart": false,
        "timestats": false,
        "axis": {
          "xAxis": "datatype",
          "yAxis": [
            "events"
          ]
        }
      },
      "search": {
        "type": "inline",
        "query": "| summarize events=count() by datatype",
        "earliest": 0,
        "latest": "now"
      },
      "id": "z7obgmgg8",
      "layout": {
        "x": 6,
        "y": 0,
        "w": 6,
        "h": 4
      },
      "type": "chart.pie",
      "title": "Events Timeline",
      "parentSearchId": "436ut3460"
    }
  ]
}
- Click
Import. - Select the
sbx-interactive-dashboard.jsonfile that you downloaded. - Click
Save and Exit. - Click
Exit.
At first glance it seems like this dashboard is broken. Once again, trust in The Force. You are about to watch this dashboard come alive.
Interactions
We are going to link our current SBX Sample Dashboard to the SBX Interactions Dashboard that we just created.
- In the left navigation bar click
Dashboards. - Click
SBX Sample Dashboard. - Click the
dashboard options icon at the top right of the page. - Click
Edit. - In the
Datasetspanel, click theedit icon.
icon. - In the
Interactionssection of theEdit modalsetActiontoAdd value to dashboard input. - For the
DashboardselectSBX Interactive Dashboard. - For
InputselectDataset (dataset).noteWhen linking to another
dashboard, theinputsare pre-filled as selectable options. Pretty helpful right?! - Close the
Editmodal. - Click
Save.
Our dashboards are officially linked. Time to see the magic first-hand.
- Click the
cribl_search_samplevalue in thedatasetcolumn of theDatasetspanel.
If configured correctly, the SBX Interactions Dashboard should open in a new window with the value cribl_search_sample pre-populated.
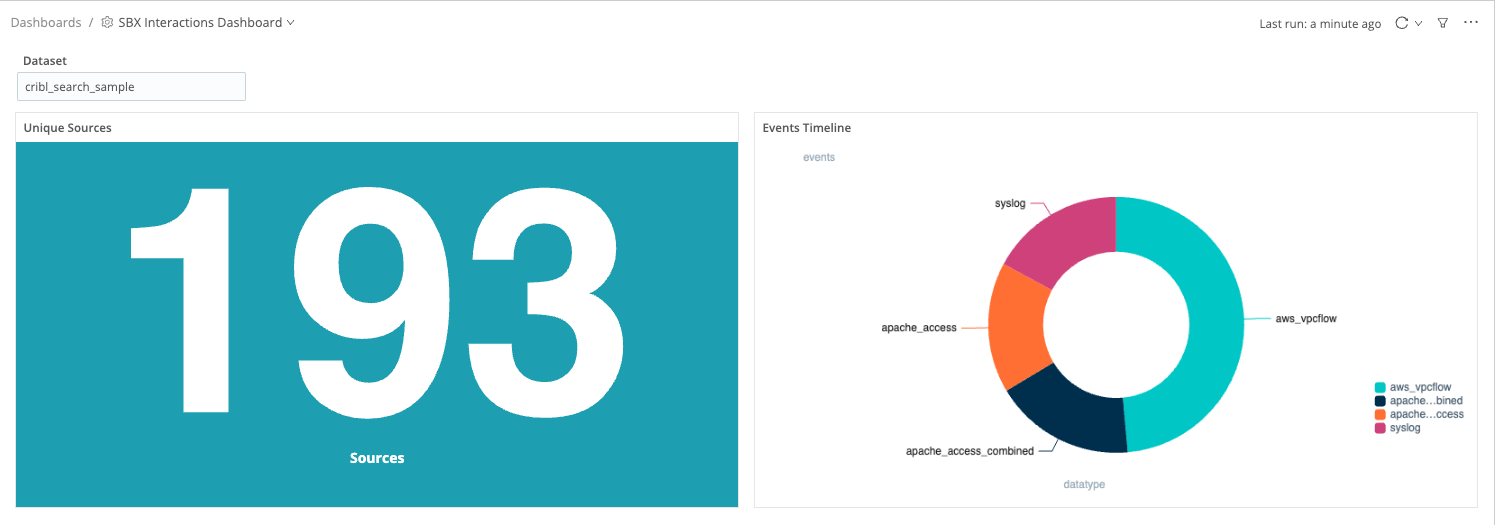
With this feature Cribl Search makes it easy to perform deeper-dive analysis on values that we find in our dashboards.