Notifying Stream
Currently, Stream supports a Push model, where the source-code repository or CI/CD tool needs to make an API call to tell Stream that a change has occurred on the branch.
Once a branch is updated (via a push or a PR merge), the repo or CI/CD tool needs to call the /api/v1/version/sync API endpoint. For the purposes of this course, we've included a script that takes care of this, but it's worth exploring the steps in that script.
Here is what you'll see if you click the Terminal top tab, and then enter cat /tmp/scripts/notify-ls.sh on the command line:
#!/bin/bash

# Authenticate and Save the Token.
TOKEN=$(curl http://gitops-cribl-prd:9000/api/v1/auth/login \
     -H 'Content-Type: application/json' \
     -d "{\"username\":\"admin\",\"password\":\"cribldemo\"}" 2>/dev/null | \
     jq -r .token)

# Set up the Authentication Header
export AUTH_HEAD="Authorization: Bearer $TOKEN"

# Make the notification call
curl -X POST "http://gitops-cribl-prd:9000/api/v1/version/sync" -H "accept: application/json" -H "${AUTH_HEAD}" -d "ref=prod&deploy=true"
This script makes two calls to the Cribl API. The first call is to authenticate with the API and generate a token to be used for the second call.
- Click
Terminalon the top nav. - Enter the following into the terminal:
/tmp/scripts/notify-ls.sh
Give it a minute or two to deploy, and then we can take a look at the production instance to see if our configuration changes made it over.
-
Click the
Stream Prodtop tab. -
In Cribl's own top nav, click the
Cribllogo at left to unroll the product selector. -
Select
Streamfrom this menu to expand Stream's top nav. -
Click
Manageon this top nav. -
Click into the
defaultWorker Group. -
Click the
Datasubmenu, then clickSources. -
On the resulting
Manage Sourcespage, locate and click theSyslogtile. (You can type its name into the filter box, or scroll down to find it.) You should now see theprod_apacheSource enabled in thisprodenvironment: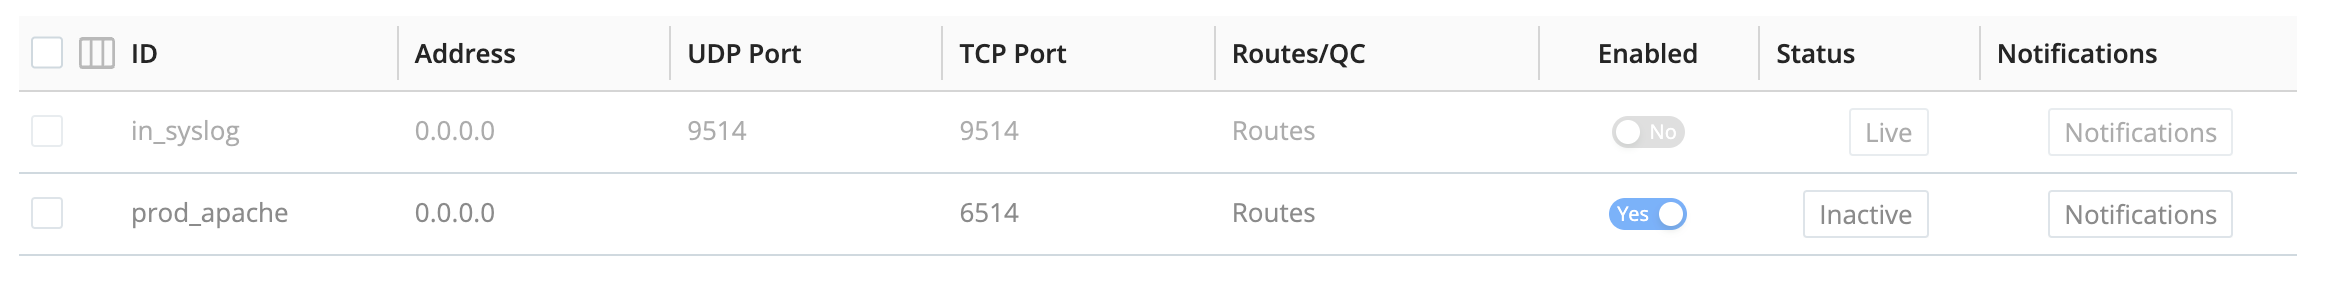
-
From Stream's top nave, now select
Data>Destinations. -
Locate and click the
Elasticsearchtile. (You can typeElasticinto the filter box, or scroll down to find the tile.) You should see both of the Destinations we created, withdev_logsgreyed out andprod_logsnow enabled: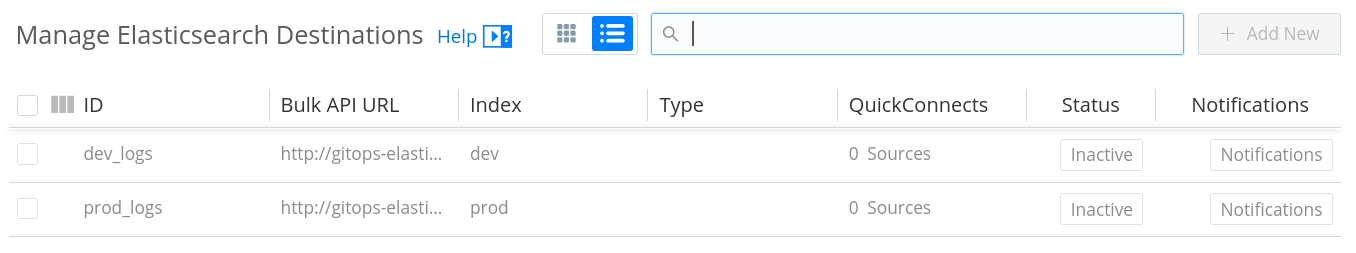
-
Click Stream's
Processingsubmenu, and selectPipelines. You can collapse thePipelinespage's right Preview pane (and/or widen your browser) to see the Pipelines' names. You should see theapache_logsPipeline at the top of the list:
-
Click Stream's
Routingsubmenu, and selectData Routes. You should see theapache_logsRoute at the top of the list. Notice the small sparkline graph confirming that data is now flowing through this Route. (You can hover over the sparkline to see details.)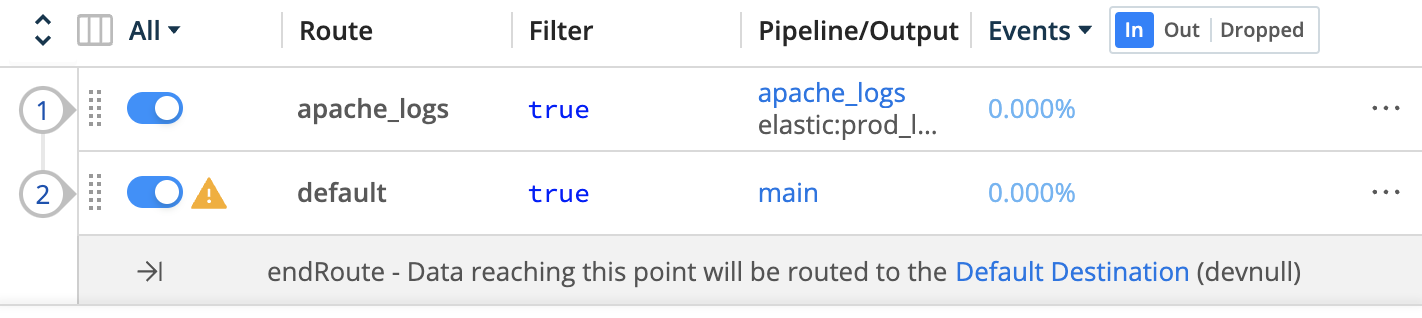
If you want to look at the datagen Sources (Datasubmenu > Sources > Datagen), you'll also see that the dev_gen source is present in this prod environment, but greyed out as inactive.
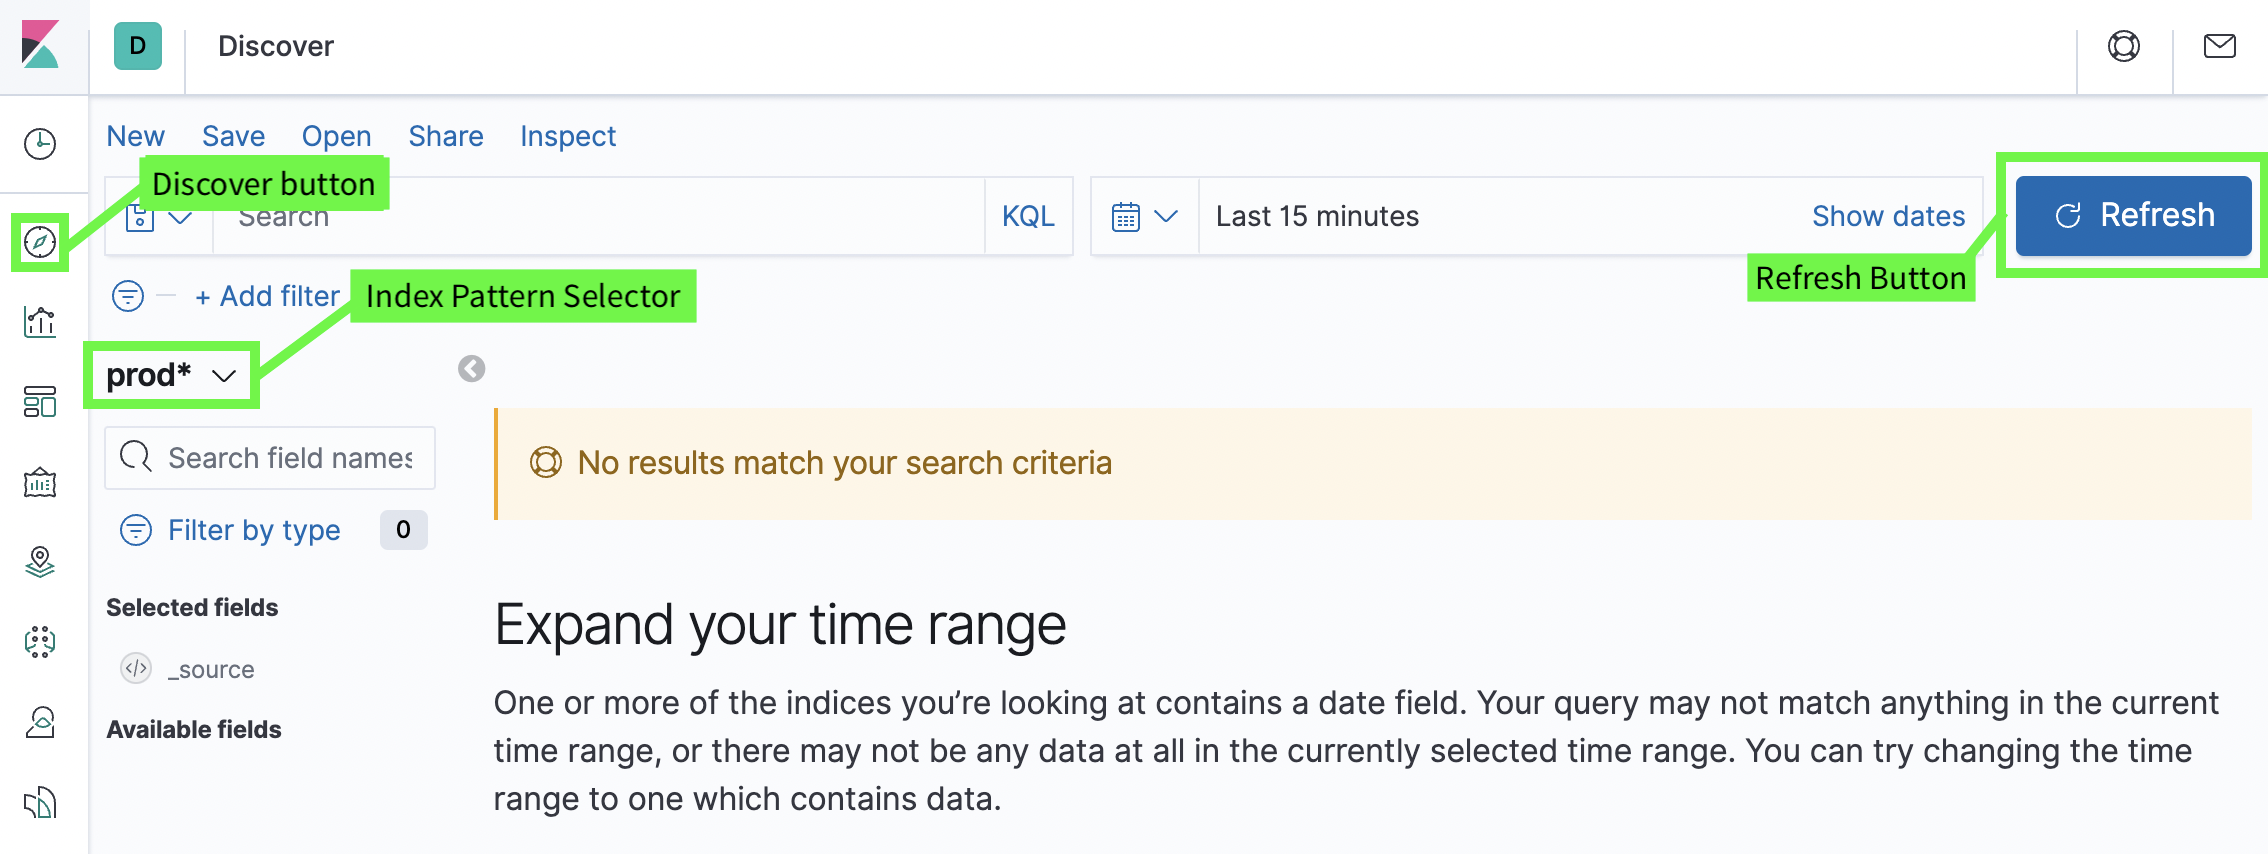
- Click the
Elasticsearch/Kibanatop tab. - In the Kibana UI's left nav, click the second button,
Discover. (See the screenshot below.) - If
dev*is not set as the index pattern, click the drop-down selector and set it. - Click
Refreshif necessary. You should now be able to confirm that Stream data is flowing into this downstream service, too.
That's it! Let's wrap up...