The Edge UI
While Cribl Edge has a "single-Node" UI that you can use on an Edge Node, the same UI (well, mostly the same) is present on the Cribl Leader for each Edge Node connected to it. We're going to look at the Leader-based version of the UI in this tutorial.
- In the Cribl UI embedded at right, the upper left corner should display a Cribl logo. If you hover over it, you'll see an app picker with two applications (
StreamandEdge) plus theCriblhome page you're initially on. Here's the app picker unrolled:
- Click on the
Edgeapplication to switch to it.
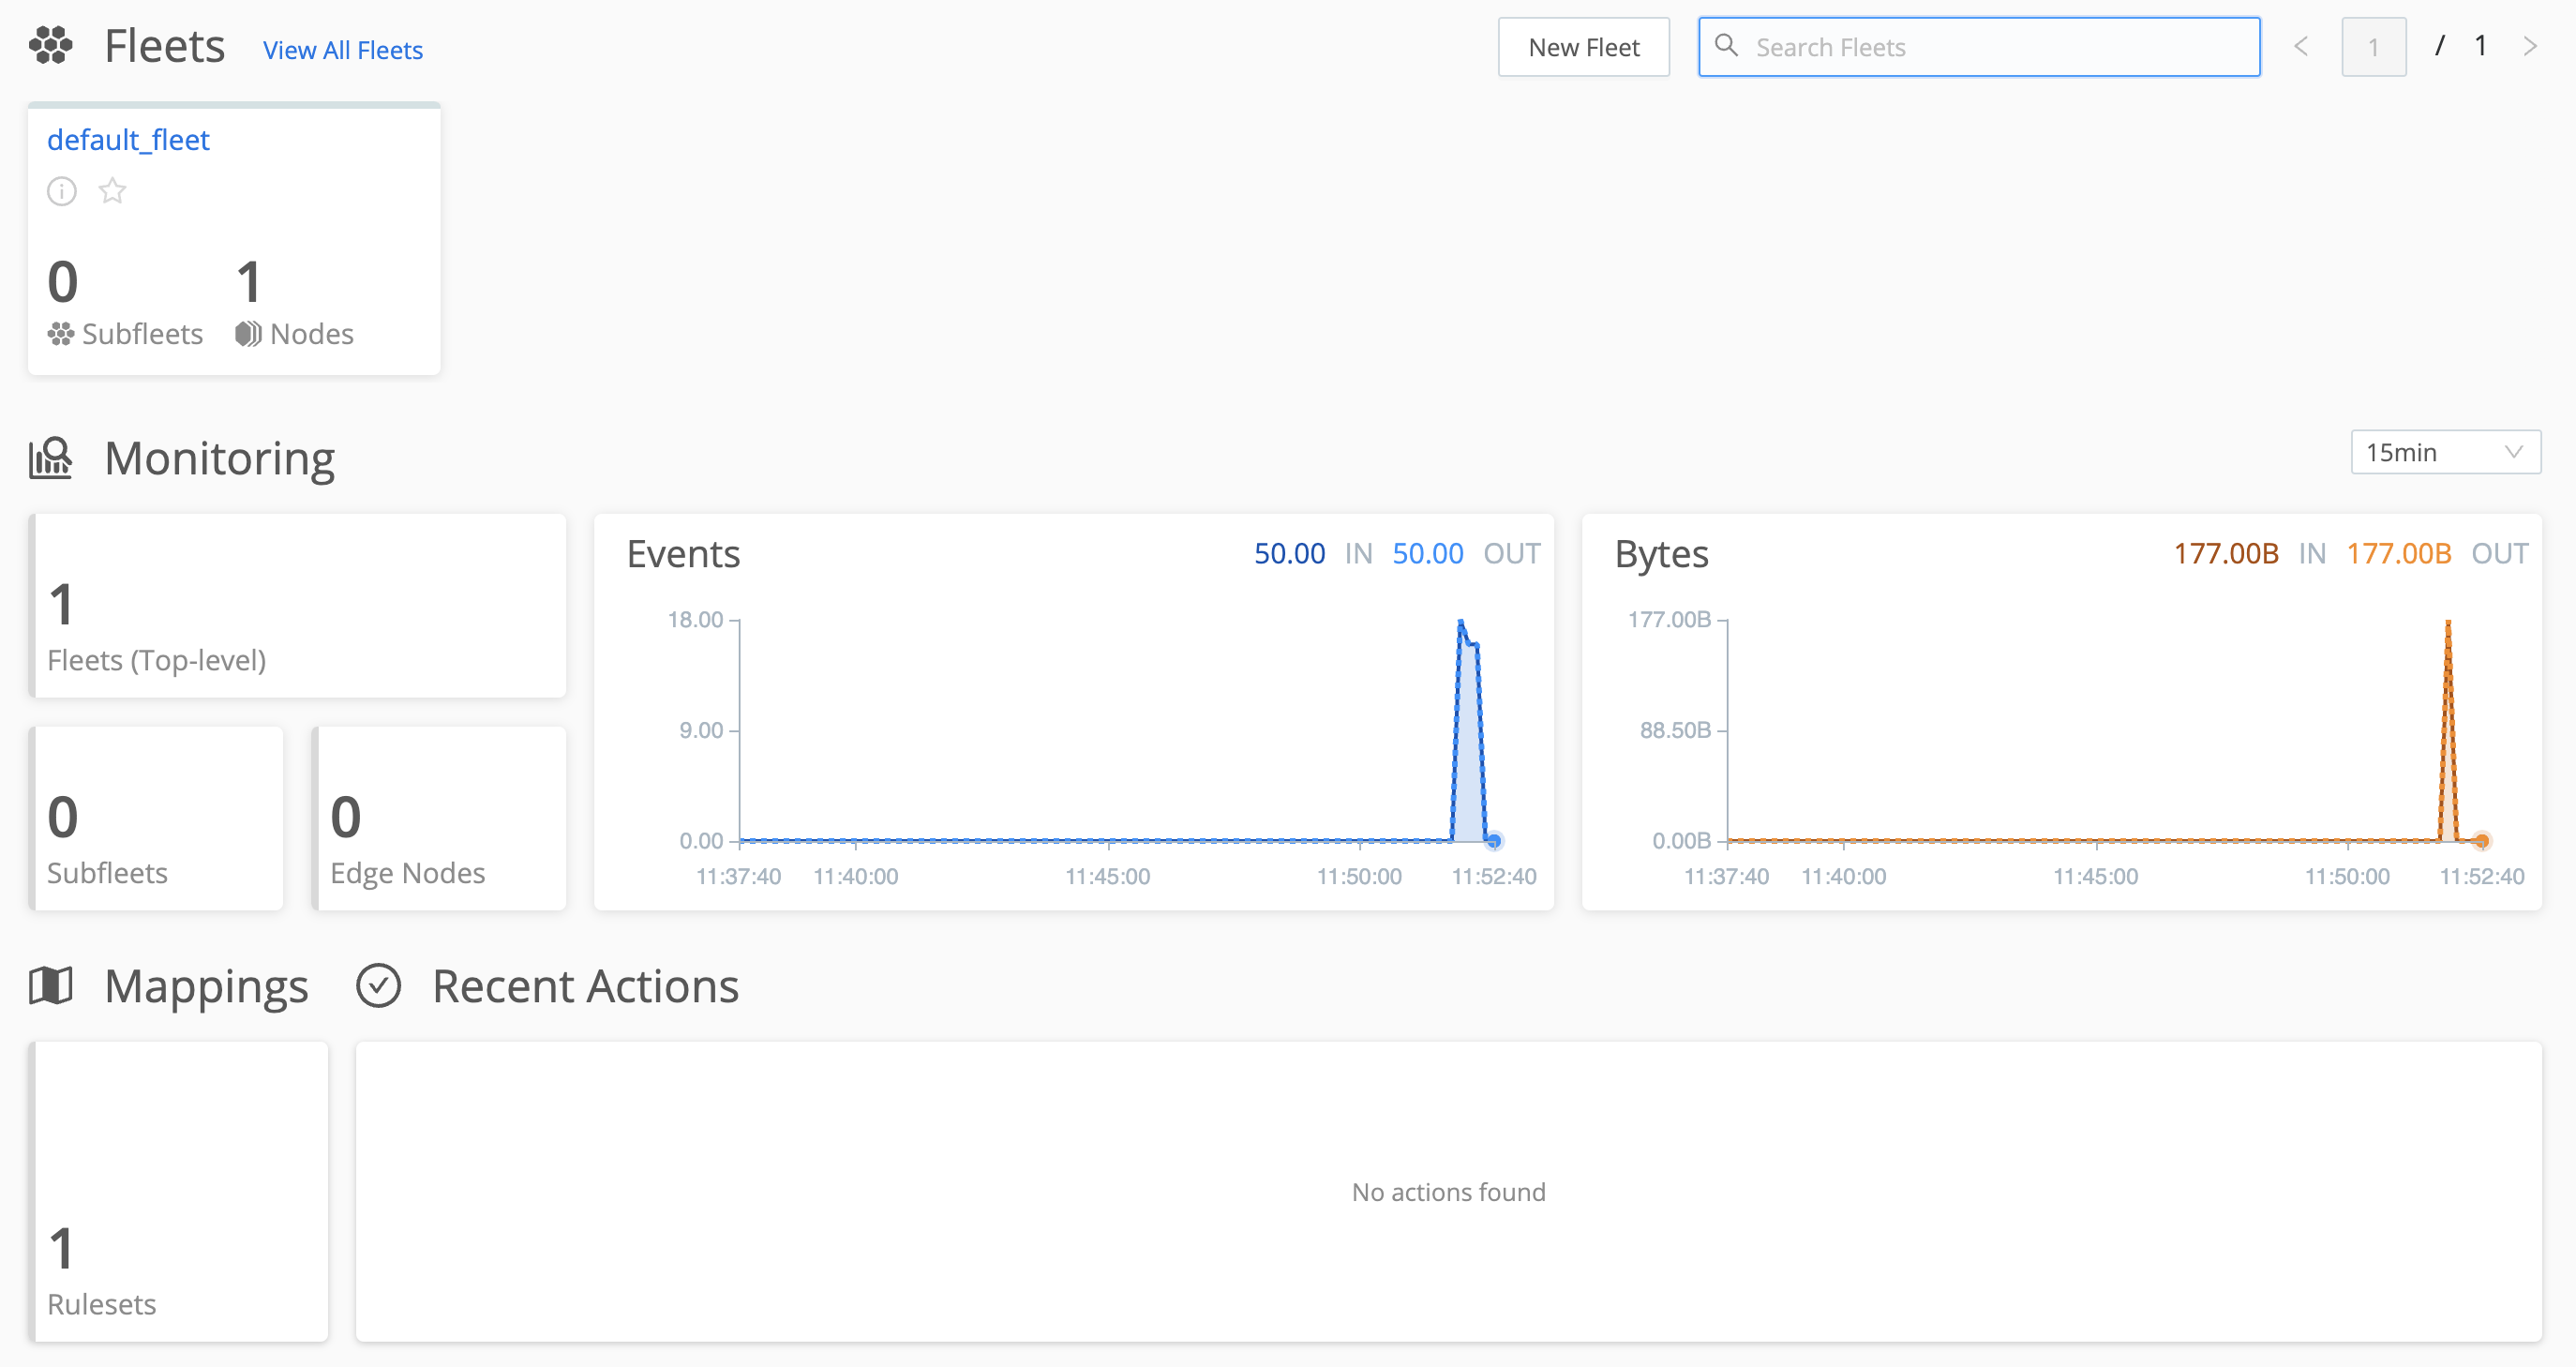
You should now see Edge's Fleets page, similar to this:
(Up on Edge's black top nav, note that you're currently on the Home page. You'd click that Home link to get back here.)
Fleets
Edge introduces the concept of "Fleets." A Fleet is fundamentally just a group of systems that share a configuration, analogous to Worker Groups in Stream. Edge comes with a default Fleet configured, called default_fleet – didn't see that coming, didya? :) Let's take a look at this default Fleet.
- Click on the
default_fleettile to go to the Fleet inspection page. - Click on the
Monitortab just next toNodes.
This page has a number of interesting things on it. You're currently on the Monitor tab, and feel free to click its adjacent Nodes tab and different views (Map View and List View) as we explore them:
-
The "at a glance" display – at top of the current
Monitortab, this shows you metrics about the systems within the Fleet. Right now, we have a single Node in the Fleet. So the metrics are specific to that one instance. -
The
Nodes > Map Viewis a way to display metrics from the systems in the Fleet. You can select from different metrics in theMeasurefield. Your selections tune a hexagon-based map view of the selected metric across all the systems in the Fleet. -
The
Nodes > List Viewis a simple list of all of the systems in the Fleet. It serves as the "transporter room," allowing you to teleport into each Node's Edge interface.
If you click on the row of an Edge Node (but not on the name) a drawer will open up to the right. In the drawer, the default System Activity tab is another at-a-glance display of metadata for that Node. Click the drawer's Data Activity tab to see graphs summarizing system activity. Node Info also contains information about the system on which Edge is running. But let's do that teleporting thing we talked about!
- Click on the
List Viewin theNodestab to switch to the List View. - In the
GUIDcolumn, click on the only item in the list.
Congratulations, you just teleported to the Edge Node!