Sources, Destinations, and Routing
So far, we've looked at the features of Edge that you might see in any agent. Let's look at some of the things that make Edge different – like the fact that you have the power of Cribl Stream baked into the agent.
If you're familiar with Stream, configuring things in Edge is going to feel second nature. And if you're not familiar with Stream, feel free to check out our other sandboxes.
So far, we've been looking at the basic stats from the Edge Nodes. Now we're going to send metrics to a Prometheus Destination, and we want the full complement of metrics...
- From the
default_fleetpage, clickMorein the upper submenu, and then selectSources. - Click on the
System Metricstile. - On the resulting
Manage Sources/System Metricspage, click on thein_system_metricsSource that's already set up for you. - In the resulting config modal, click on the
Host Metricsleft tab. - Click on the
Allbutton (next toBasic). We want them all! - Click
Savebutton at the bottom right.
We've now got detailed metrics configured. Let's send them to Prometheus and take a look at them. We've already got a Prometheus Destination setup, so let's send our metrics there using Edge's graphical QuickConnect UI.
-
From Edge's submenu, click
Collect.You should now see a QuickConnect page, looking something like this:
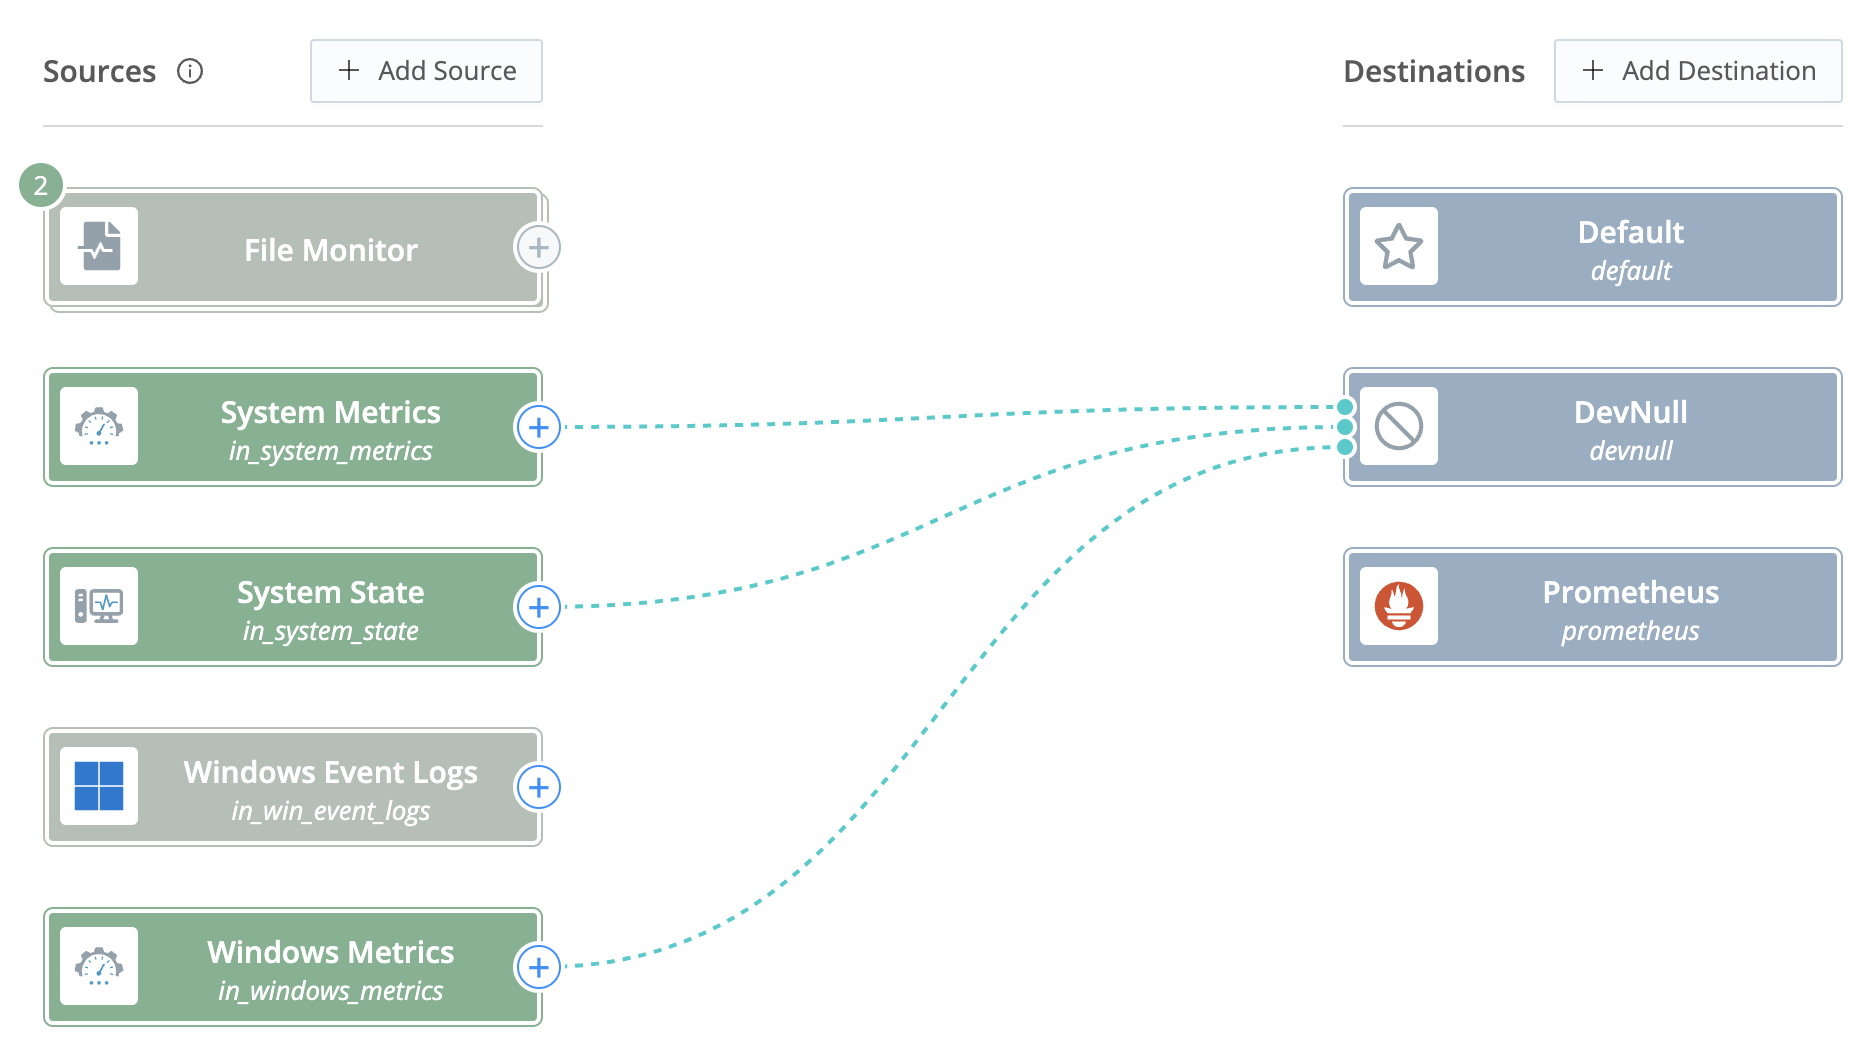 Right now, our metrics data is being sent to the DevNull Destination, which simply discards it. Let's change that.
 -
On the
DevNulltile, click the blue connector from theSystem MetricsSource, and drag it over to thePrometheusDestination tile. -
In the resulting confirmation modal, click
OK. (If, instead of the confirmation modal, you see aConnection Configurationmodal, selectPassthruand clickSave.) -
Click the
Commit & Deploybutton at Edge's upper right. -
In the resulting confirmation modal, click
Commit and Deploy.
- If you see separate buttons for
CommitandDeploy, click onCommit, enter a commit message (if one is not already present), and clickCommit Changes. Then click theDeploybutton and confirm again in the resulting confirmation modal. - If you don't see
Commit & Deployand you don't see separateCommitandDeploybuttons, look at the top of your Edge UI. If it has a purple outline, then you've navigated into one of the Nodes. You can make changes in the individual Nodes, but they will not persist (they will be overwritten by the nextCommit & Deployof the Fleet). In order to navigate back to the Fleet, click the close box [X] at the top right of the purple banner.
It's as simple as that. Once the Edge Nodes get the new configuration, metrics will start flowing to our Prometheus Instance. Let's take a look...
- In the top tabs bar, click on the
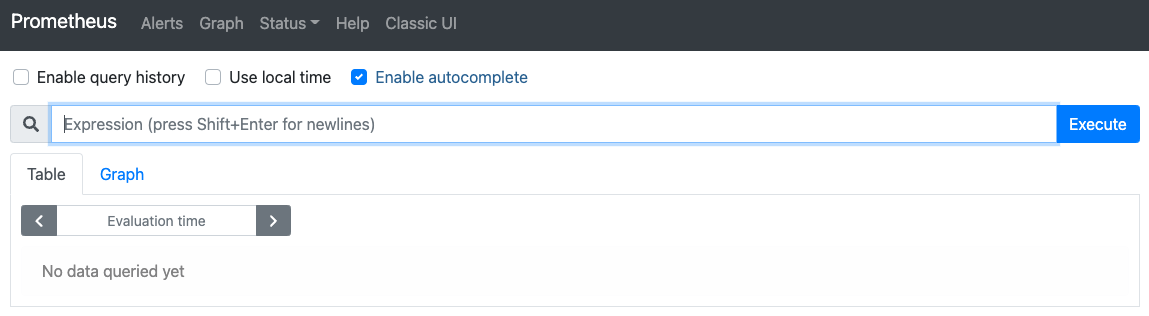
Prometheustab. - You should see the Graph query page, like this:
 (If you don't, click on the
 Graphlink at the top of the Prometheus UI.) - In the query bar, type the word
node– you should start to see a drop-down list of metrics that relate to the wordnode. If you don't, wait a minute or so, and try again. It's likely that the Edge Node is still getting its config.
You can scroll through the list to see what metrics Edge provides. Click a metric, followed by the Execute button, to display the results in the Table view. Click the Graph tab to generate a graph of the same data.
Take a few minutes to explore the Node metrics, and then we'll take a look at Log File Autodiscovery.