Log File Source
Finally, one of the things that really makes Edge unique is log file autodiscovery - Edge is aware of every file opened for writing on its host system, and can monitor any or all of them. Let's take a look.
- On the top tabs bar, click the
Cribltab to get back to our Edge UI. - From Edge's own top nav, click
Manage. On the resulting page, click ondefault_fleet. - Click to open the
Moresubmenu, then selectSources. - From the resulting
Manage Sourcespage, find and click on theFile Monitortile. - On the
Manage Sources / File Monitorpage, click on thein_file_autoSource to open its configuration modal.
On the modal's right side, you should now see something similar to this:
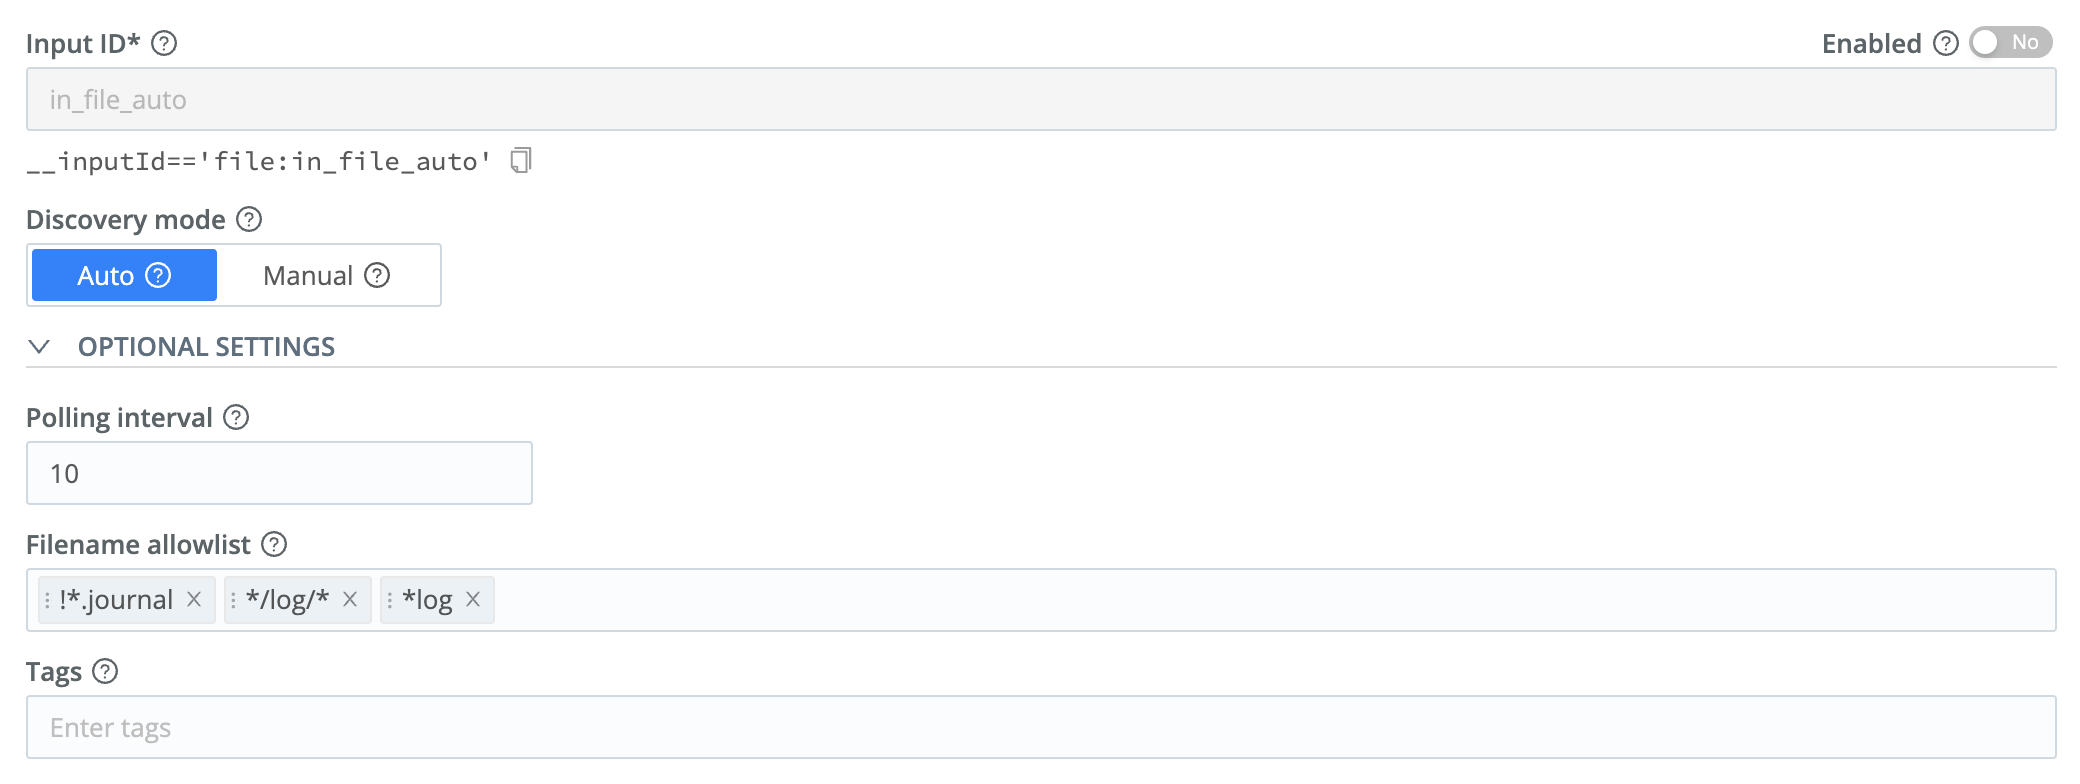
There are a couple things in this config modal that bear explaining. First, the Discovery mode toggle buttons. If you set these to Manual, you have to specify every file you want to monitor. But in the Auto mode, Edge finds every file that's open for writing on its host system, and you set a Filename allowlist of the file patterns you want to include. This list contains a set of wildcard strings.
In this config, it's set to look for anything that does not end in .journal (there's a separate Source for that), anything in a directory named log anywhere on the system, and any file that ends in log. This Source is already in use internally (which is how we earlier saw the files in the Explore Edge > Files section), but its data is not being sent anywhere. Now, we're going to take a look at the "manual" File Monitor Source that is set up by default.
- Click on the
Xor theCancelbutton to close thein_file_autoSource's config modal. - Back on the
Manage Sources / File Monitorpage, click thein_file_varlogSource belowin_file_auto. This will open this Source's config modal.
You should see something like this:

Here, the discovery mode is set to Manual, which means we specify the path to search, in addition to setting a Filename allowlist. In this config, the Search path is set to /var/log, with an unlimited Max depth setting.
The Max depth setting determines how many directory "levels" the Source will traverse to find files that match the Filename allowlist. For example, consider the following excerpt from a typical Ubuntu /var/log:

if we have Max depth set to 1, with an allowlist of !\*.journal\*, !\*.gz, \*log, the Source will find only things that end in log in the top level of the directory - highlighted in green below:

By changing the Max depth to 2 (or unlimited in this case, since our tree has only 1 additional level below the top-level directory), you'll see it pick up more files:

Now, let's enable both of these File Monitors. They're both set up as QuickConnect Sources, so they're disabled until we connect them to a Destination. Let's do that.
- Click on the
Xor theCancelbutton to close thein_file_autoconfig modal. - Click Edge's
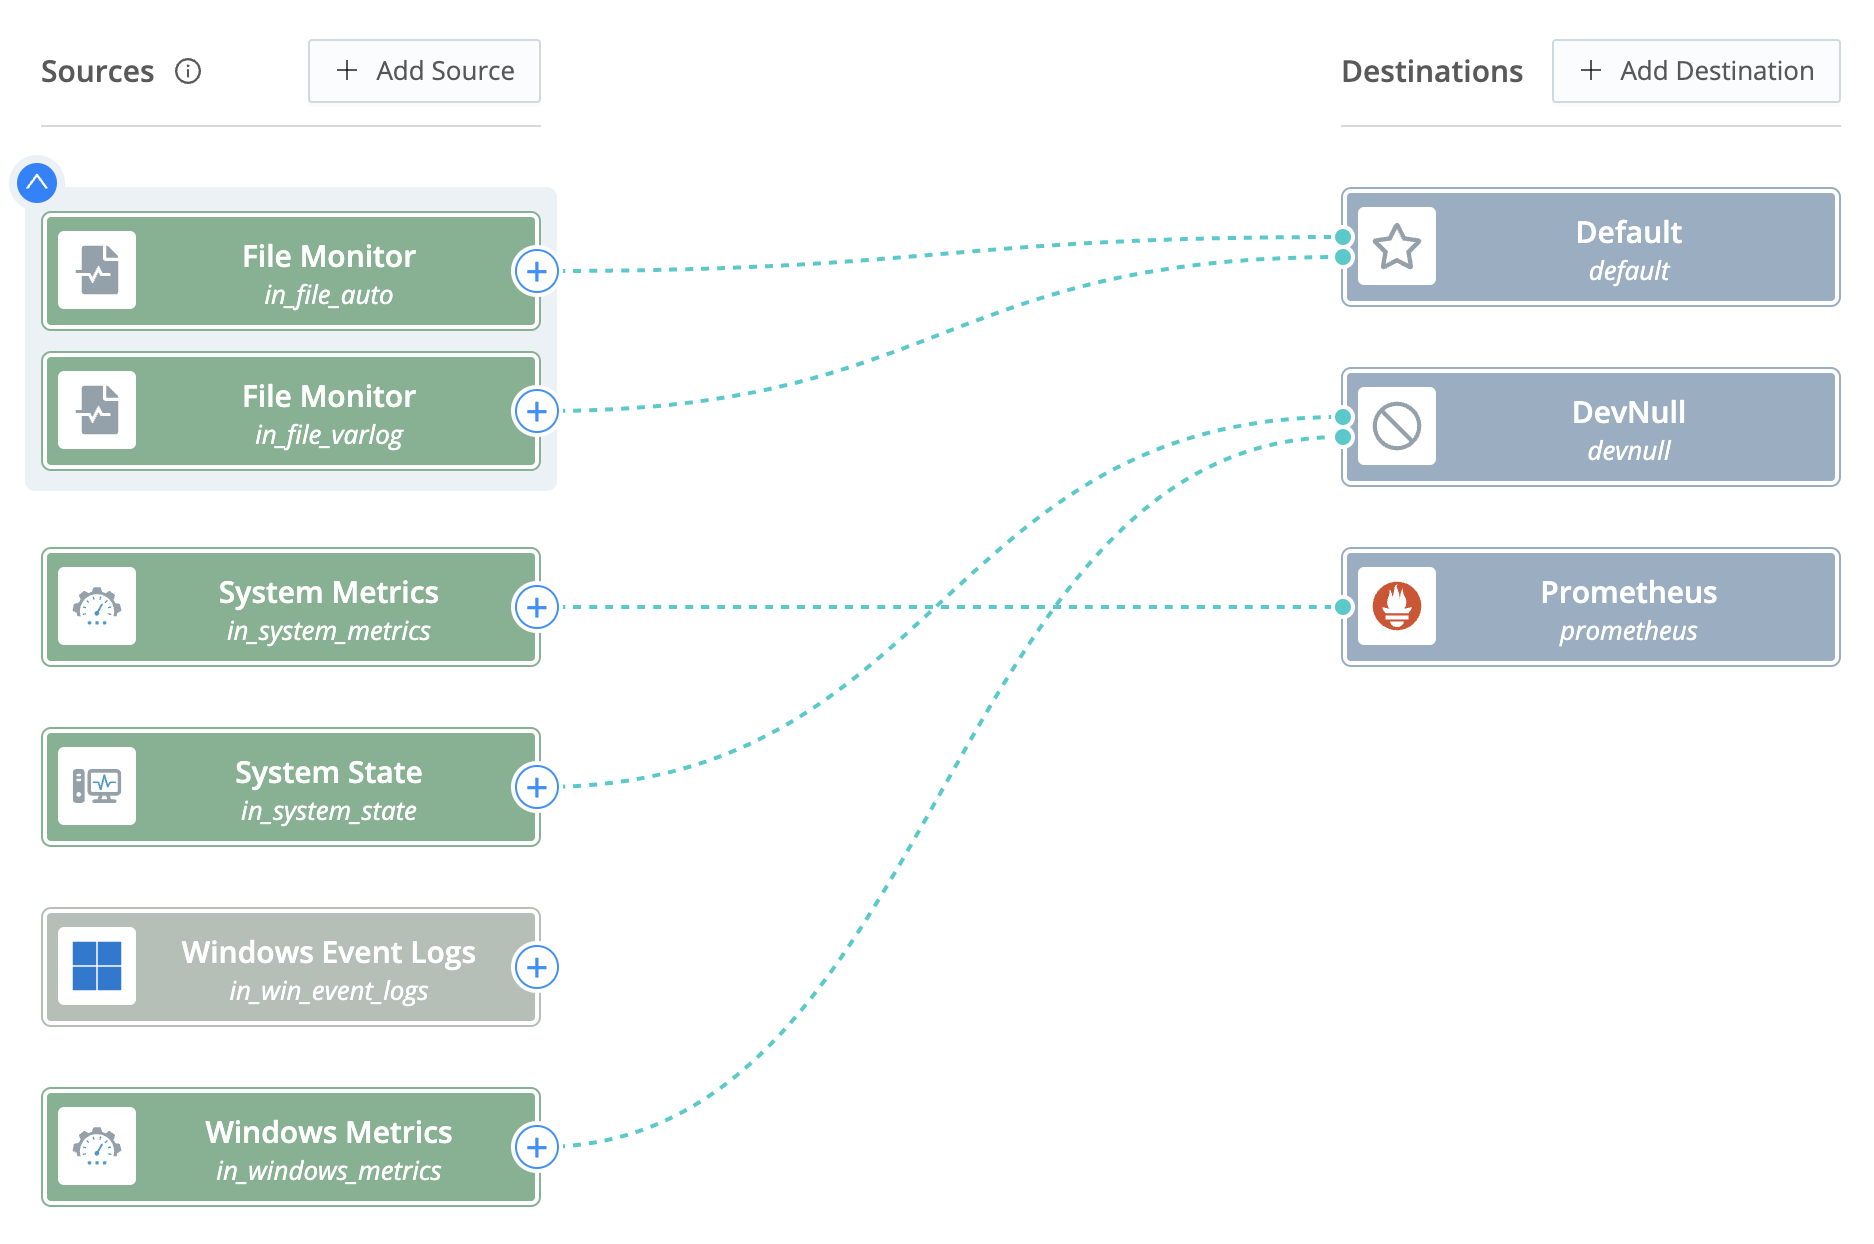
Collectsubmenu. This will restore the QuickConnect UI. - Above the File Monitor Source's left tile, click the number
2to expand the two File Monitor Sources. - From the
in_file_autoSource, click the+button, drag a connector over to theDefaulttile, and drop it onto that tile. - In the resulting
Connection Configurationmodal, clickSaveto confirm that you want to configure the connection asPassthru. - From the
in_file_varlogSource, click on the+button, drag a connector over to theDefaulttile, and drop it onto that tile. - In the resulting
Connection Configurationmodal, clickSaveto confirm that you want to configure the connection asPassthru. - Click the
Commit & Deploy(orCommit) button at Edge's upper right. - In the resulting confirmation modal, enter a
Commit message(if needed), then click onCommit and Deploy.
Let's see what the new File Monitor is seeing.
- Hover the mouse over the
in_file_varlogsource tile. From the resulting options, click onConfigureto open this Source's configuration drawer. - Click on the drawer's
Statustab. Expand either of the Hosts that you see there, and you should see a list of the files that Edge is monitoring. (If you don't see a list of files show up, the changes likely haven't finished deploying – wait a minute or so, and check again.) - You can also look at the
Logstab, where you should see an accordion for each file in/var/log. Expand a few accordions to fineadd file monitororstart monitoring fileentries.
That's everything for now! Let's finish things up.