Rolling Up Metrics
In general, metrics are generated whenever a matching log line appears in logs. This may not be desired behavior depending on the downstream system. To minimize metric events, you might want to "Roll Up" metrics to a specific time window.
To see this in action, let's take a look at the output metrics for our InfluxDB Destination:
- On the top menu, click Cribl.
- Click Monitoring > Data > Destinations.
- Locate the
influxdb2entry in the sparklines charts that appear. - In the upper right, change the time window to
5min(It defaults to15minutes) - it will make it easier to see the difference.
Based on the configuration for this sandbox, you should see something like this:
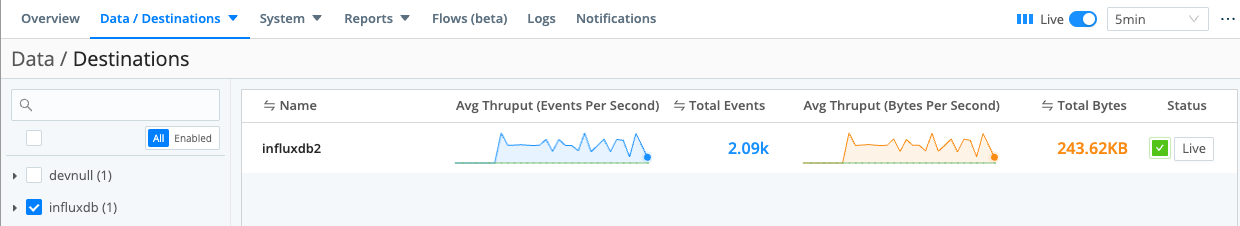
As you can see, we're currently sending about 8 events per second to influxdb. Now, let's configure the Rollup Metrics function, and see how it changes this.
- In Stream's top nav, select Manage > Processing > Pipelines (don't confuse this with the Pipelines submenu in the Monitoring section - that will just show you Pipeline statistics).
- Click the
access_combined_metricsPipeline. - Click Add Function, and select or search for the Rollup Metrics function - click on its name to add it.
- Click Save.
The configuration screen for Rollup Metrics should look something like this:
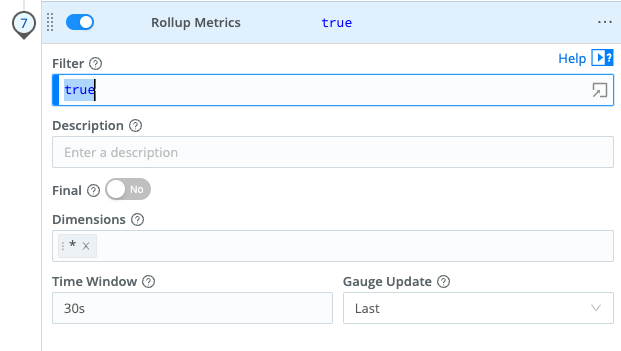
This "default" setup rolls up metrics every 30 seconds. You can change that by manipulating the time-window value. Now let's see what effect that change has:
- In Stream's top nav, click Monitoring.
Note: Depending on the size of your window, the top nav will consolidate items that won't fit in a pulldown represented by an ellipsis (
...) - if so, click the ellipsis and then click Monitoring > Data > Destinations on the resulting view. - Locate the
influxdb2entry in the sparklines charts that appear. - In the upper right, change the time window to
5min(It defaults to15minutes) - it will make it easier to see the difference.
Since you're changing the time window, it will take a little bit of time to see the results, but you should see a reasonably significant drop in EPS as well as Bps, and the write pattern should become more spikey (since it will now emit events every 30 seconds, so the gaps between emitting metric events becomes pretty obvious):
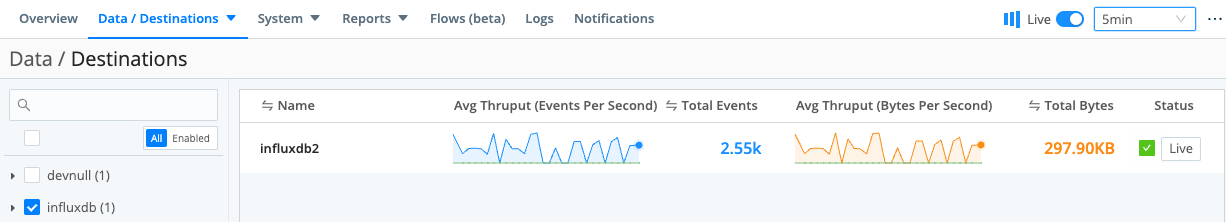
Feel free to explore, changing the time-window value and looking at the monitoring stats to see how changes impact the throughput.