Publish Metrics
So far, we've created two aggregations: a count Function, and a sum Function. Now, we need to transform the data into a metrics payload that can be delivered to our target system.
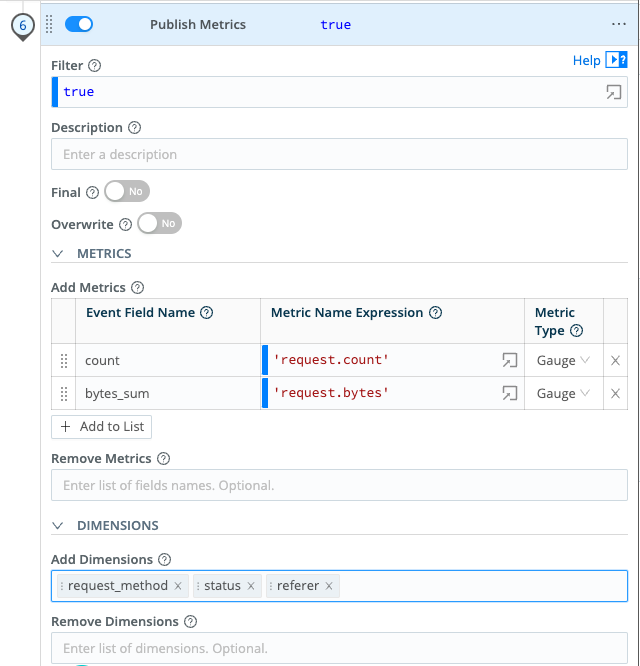
We will use the Publish Metrics function to define the metrics that will be published. This function allows us to rename the metrics and define their type for the downstream system.
We will rename the count field as request.count, and the bytes_sum field as request.bytes. We'll also specify our three dimensions (request_method, status, referer).
- In the
access_combined_metricsPipeline, click Add Function, and select Publish Metrics from the Advanced menu (or type in Publish Metrics in the search field). - Click Add to List.
- Under Event Field Name, enter
count, and under Metric Name Expression, enter'request.count', and make sure that the Metric Type is set toGauge. - Click Add to List to create another metric line.
- In the Event Field Name, enter
bytes_sum, and in the second column, enter'request.bytes', and column three needs to beGauge. - In the Add Dimensions field, delete the default values (by clicking on the
Xnext to the value) and enter the fieldsrequest_method,status, andreferer. In this field, type in each one individually, separated by carriage returns. - Click Save.
Your function configuration should look something like this:
While we're only entering a fixed string (that's why we need the single quotes around 'request.count' and 'request.bytes') in the Metric Name Expression field, this field is a JavaScript expression, so it can be used to programatically generate the metric field name. If you haven't yet, we recommend you also take the JavaScript Expressions tutorial.
In the Sample Data pane, click on the Simple Preview to see that all of the original events are stricken out. If you scroll down in the right pane to the bottom, your sample data should now look something like this:
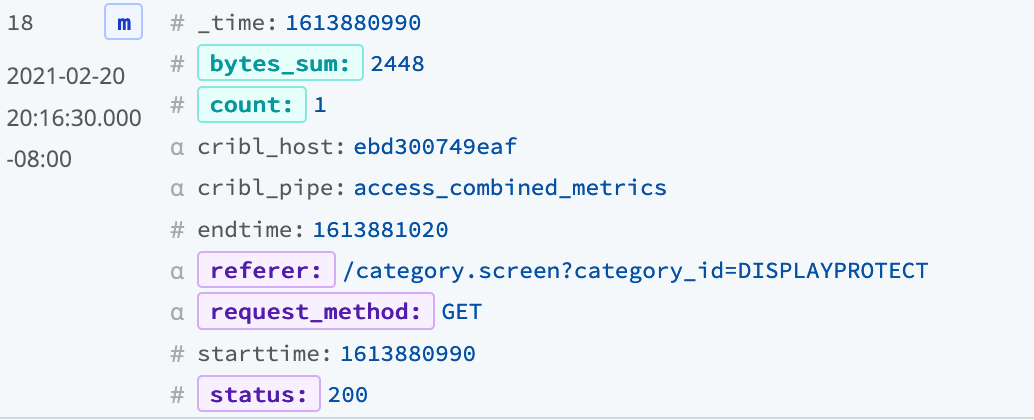
Metrics are highlighted in the aqua/teal color, and the dimensions are highlighted in lavender.
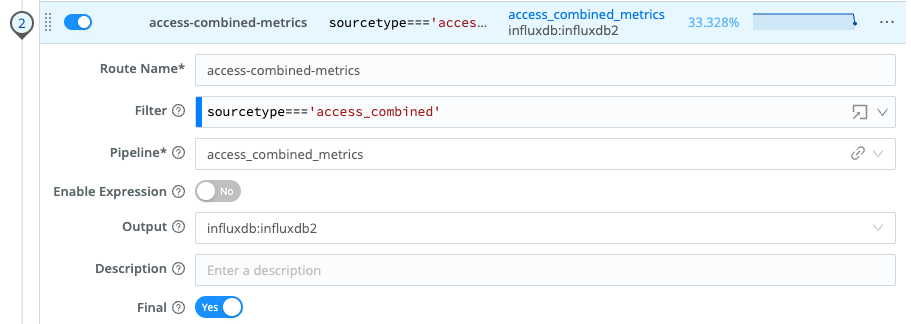
Now that we have metrics coming out of this Pipeline, we need to change the Route to point to the the InfluxDB Destination (named as influxdb:influxdb2 in our config).
- Select the Routing submenu, then click Data Routes.
- Click on the
access-combined-metricsroute. - Change the Output to
influxdb:influxdb2. - Click Save.
Your Route configuration should now look something like this:
On the top menu, click the InfluxDB tab and log in to the InfluxDB interface:
| Username | Password |
|---|---|
| admin | cribldemo |
Once logged in, click Dashboards in the InfluxDB left nav, and then on Access Combined Dashboard - you should now see data start to flow to the dashboard.
We recommend that you change the time window in the InfluxDB UI for the dashboard from past 1h to past 5m - it makes seeing changes as they occur a little easier.