Creating Aggregations
Normalizing our data
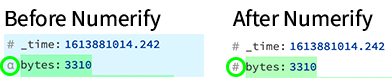
When our Pipeline extracts our data, all fields are treated as text, but we need any numeric data to be treated as numeric data. We're going to use a very simple function, Numerify, which walks through all of the fields in each event and converts their data to numbers if they're numeric.
- In the
access_combined_metricsPipeline, click Add Function and select Numerify from the Standard menu (or type Numerify in the search field). - Click Save.
In the right pane, you should see that the type of the bytes field has changed from text to number, as shown in this image:
Technically, the Numerify function is not needed in this case, since the Aggregations function will convert any fields being aggregated to numeric format. We include it here for completeness.
Now we can generate our aggregations.
- In the
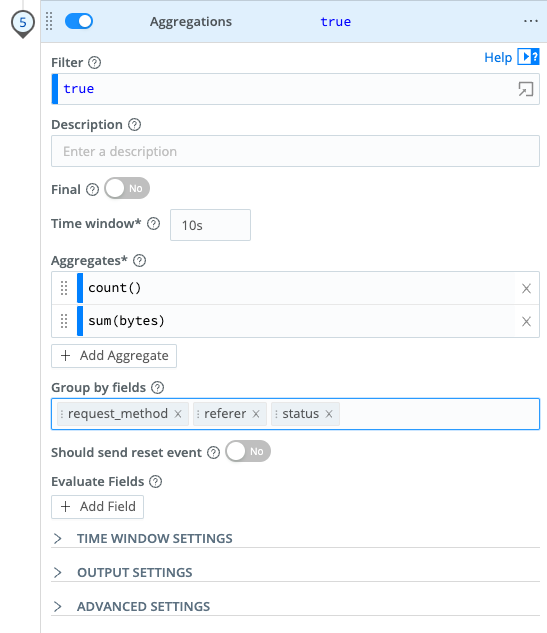
access_combined_metricsPipeline, click Add Function and select Aggregations from the Standard menu (or type Aggregations in the search field). - In the Aggregates field, enter
count(), and click Add Aggregate. - In the second Aggregates field, enter
sum(bytes) - In the Group by field, type in these fields:
request_method,referer, andstatus. In this field, type in each one individually, separated by carriage returns. Note: The order of the fields does not matter, they just need to be present. - Click Save.
This is how the Function configuration should look:
All of your events in the Sample Data pane should be stricken out. You must scroll down to the end to see the aggregated events. Or, select the Settings menu (the gear next to the Select fields pulldown) and disable Show Dropped Events). Those aggregated events should look something like this:
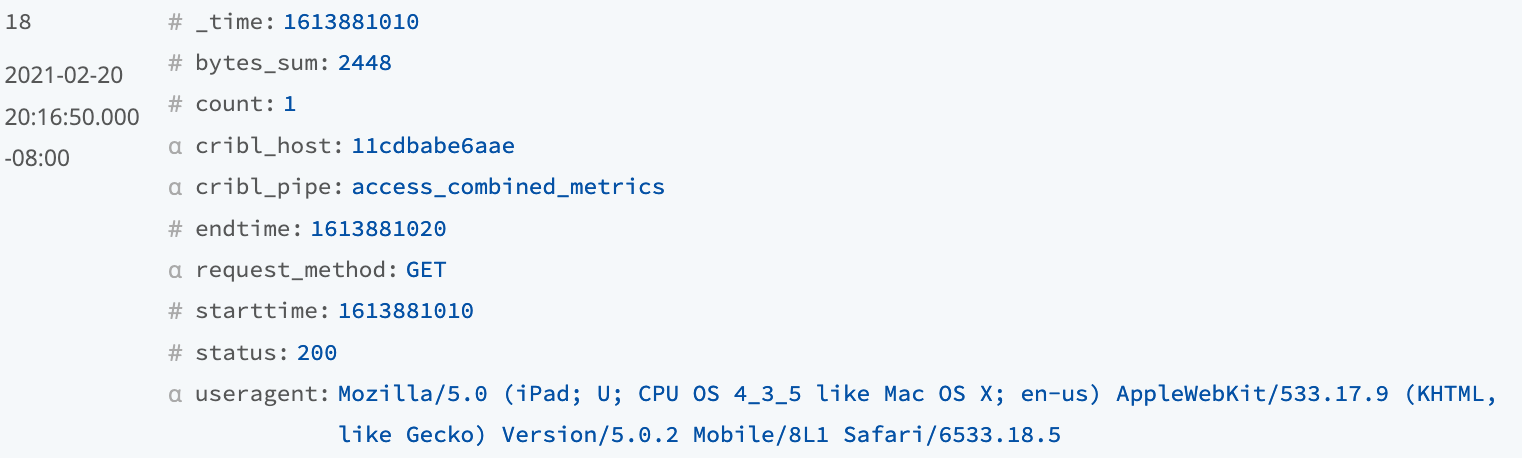
Referring back to the metrics discussion in the overview, the count() and sum(bytes) are the metrics, and the Group by fields are the dimensions.
You can turn on Metrics mode in the Output Settings to simply publish the events as metrics. However, prior to moving to the next section, ensure that Metrics mode is turned off. As we'll see in the next section, we can achieve the same goal using the Publish Metrics function, while setting specific metric names for our InfluxDB Destination at the same time.