Extracting Metric Data From Logs
Log data comes in all shapes and sizes. In this tutorial, we're going to work with two different types of logs. The sandbox already has two datagens feeding it the data we need. Both datagens have already been configured with Routes and Pipelines, which parse the incoming data to produce fields, as shown in the other sandboxes.
Access Combined Logs (Apache web log)
- With Manage active in Stream's top nav, select the Processing submenu, then click Pipelines.
- You may need to expand the window, or use the resize bar, to be able to see the Pipeline names. You can also click on the three vertical bars in the pipeline header, and turn off all the columns except the Pipeline name column.
- In the Pipelines list, click on the
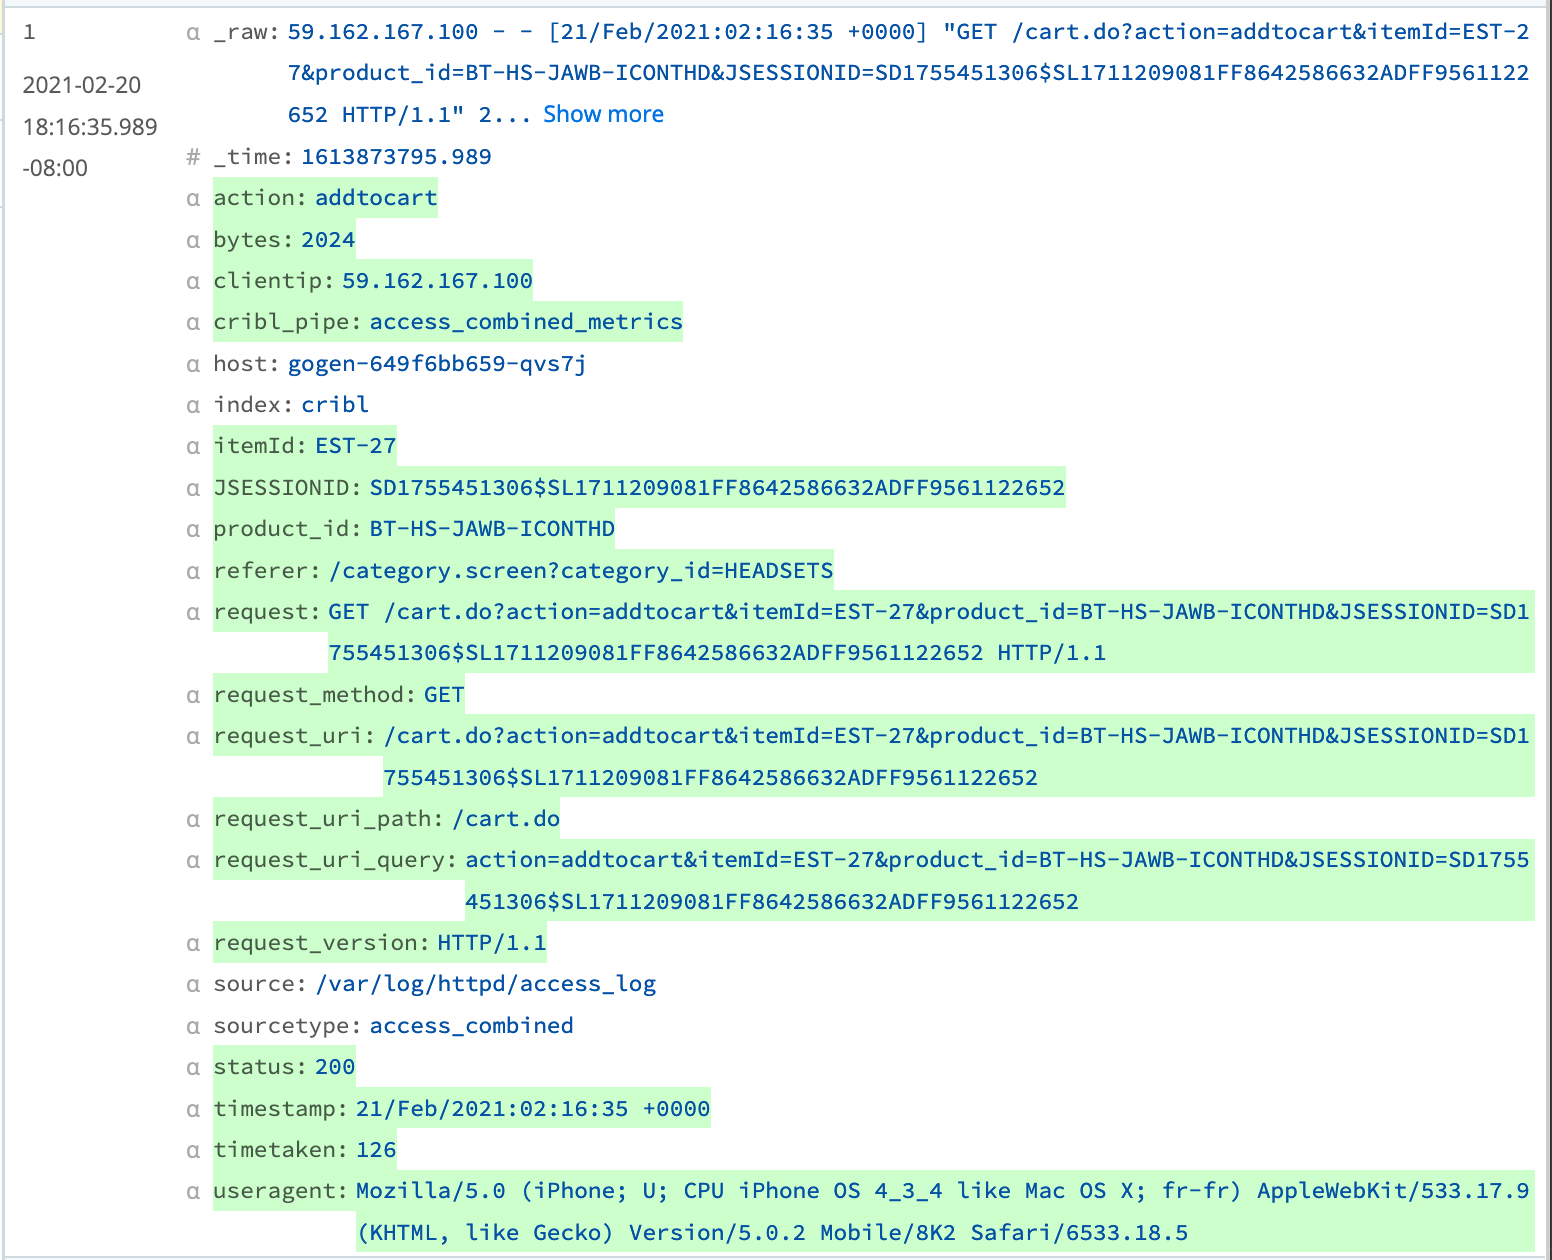
access_combined_metricspipeline. - In the Sample Data right pane, click Simple next to the
access_combined_sample.log, and select the OUT link near the top of the page.
As you can see in the image below, the Pipeline already extracts all of the fields we need.
In the next step, we'll create aggregates by counting entries and summing response bytes, as well as creating a couple different dimensions.
The second datagen is generating a set of anonymized VPC flow log events. This will be used in the practice portion at the end of this tutorial.
We will now need to add Functions to create metrics using this data.