Adding a Route
In this section, we'll add a second Destination to route a copy of all events to the filesystem. We'll learn a bit more about backpressure, and will show interactively how Stream behaves when one Destination is online but another is not.
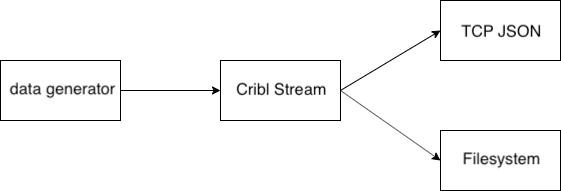
Writing events to the filesystem is a very handy capability, and we often use it to interconnect to cheap storage like a NAS with NFS mount, or to systems like Hadoop which have a filesystem driver. After adding the Destination, our setup will look like this:
fs Destination- Select the
Datasubmenu and clickDestinations. - Locate and click on the
Filesystemtile.- You can use the search box.
- At the upper right, click
Add Destination. - In
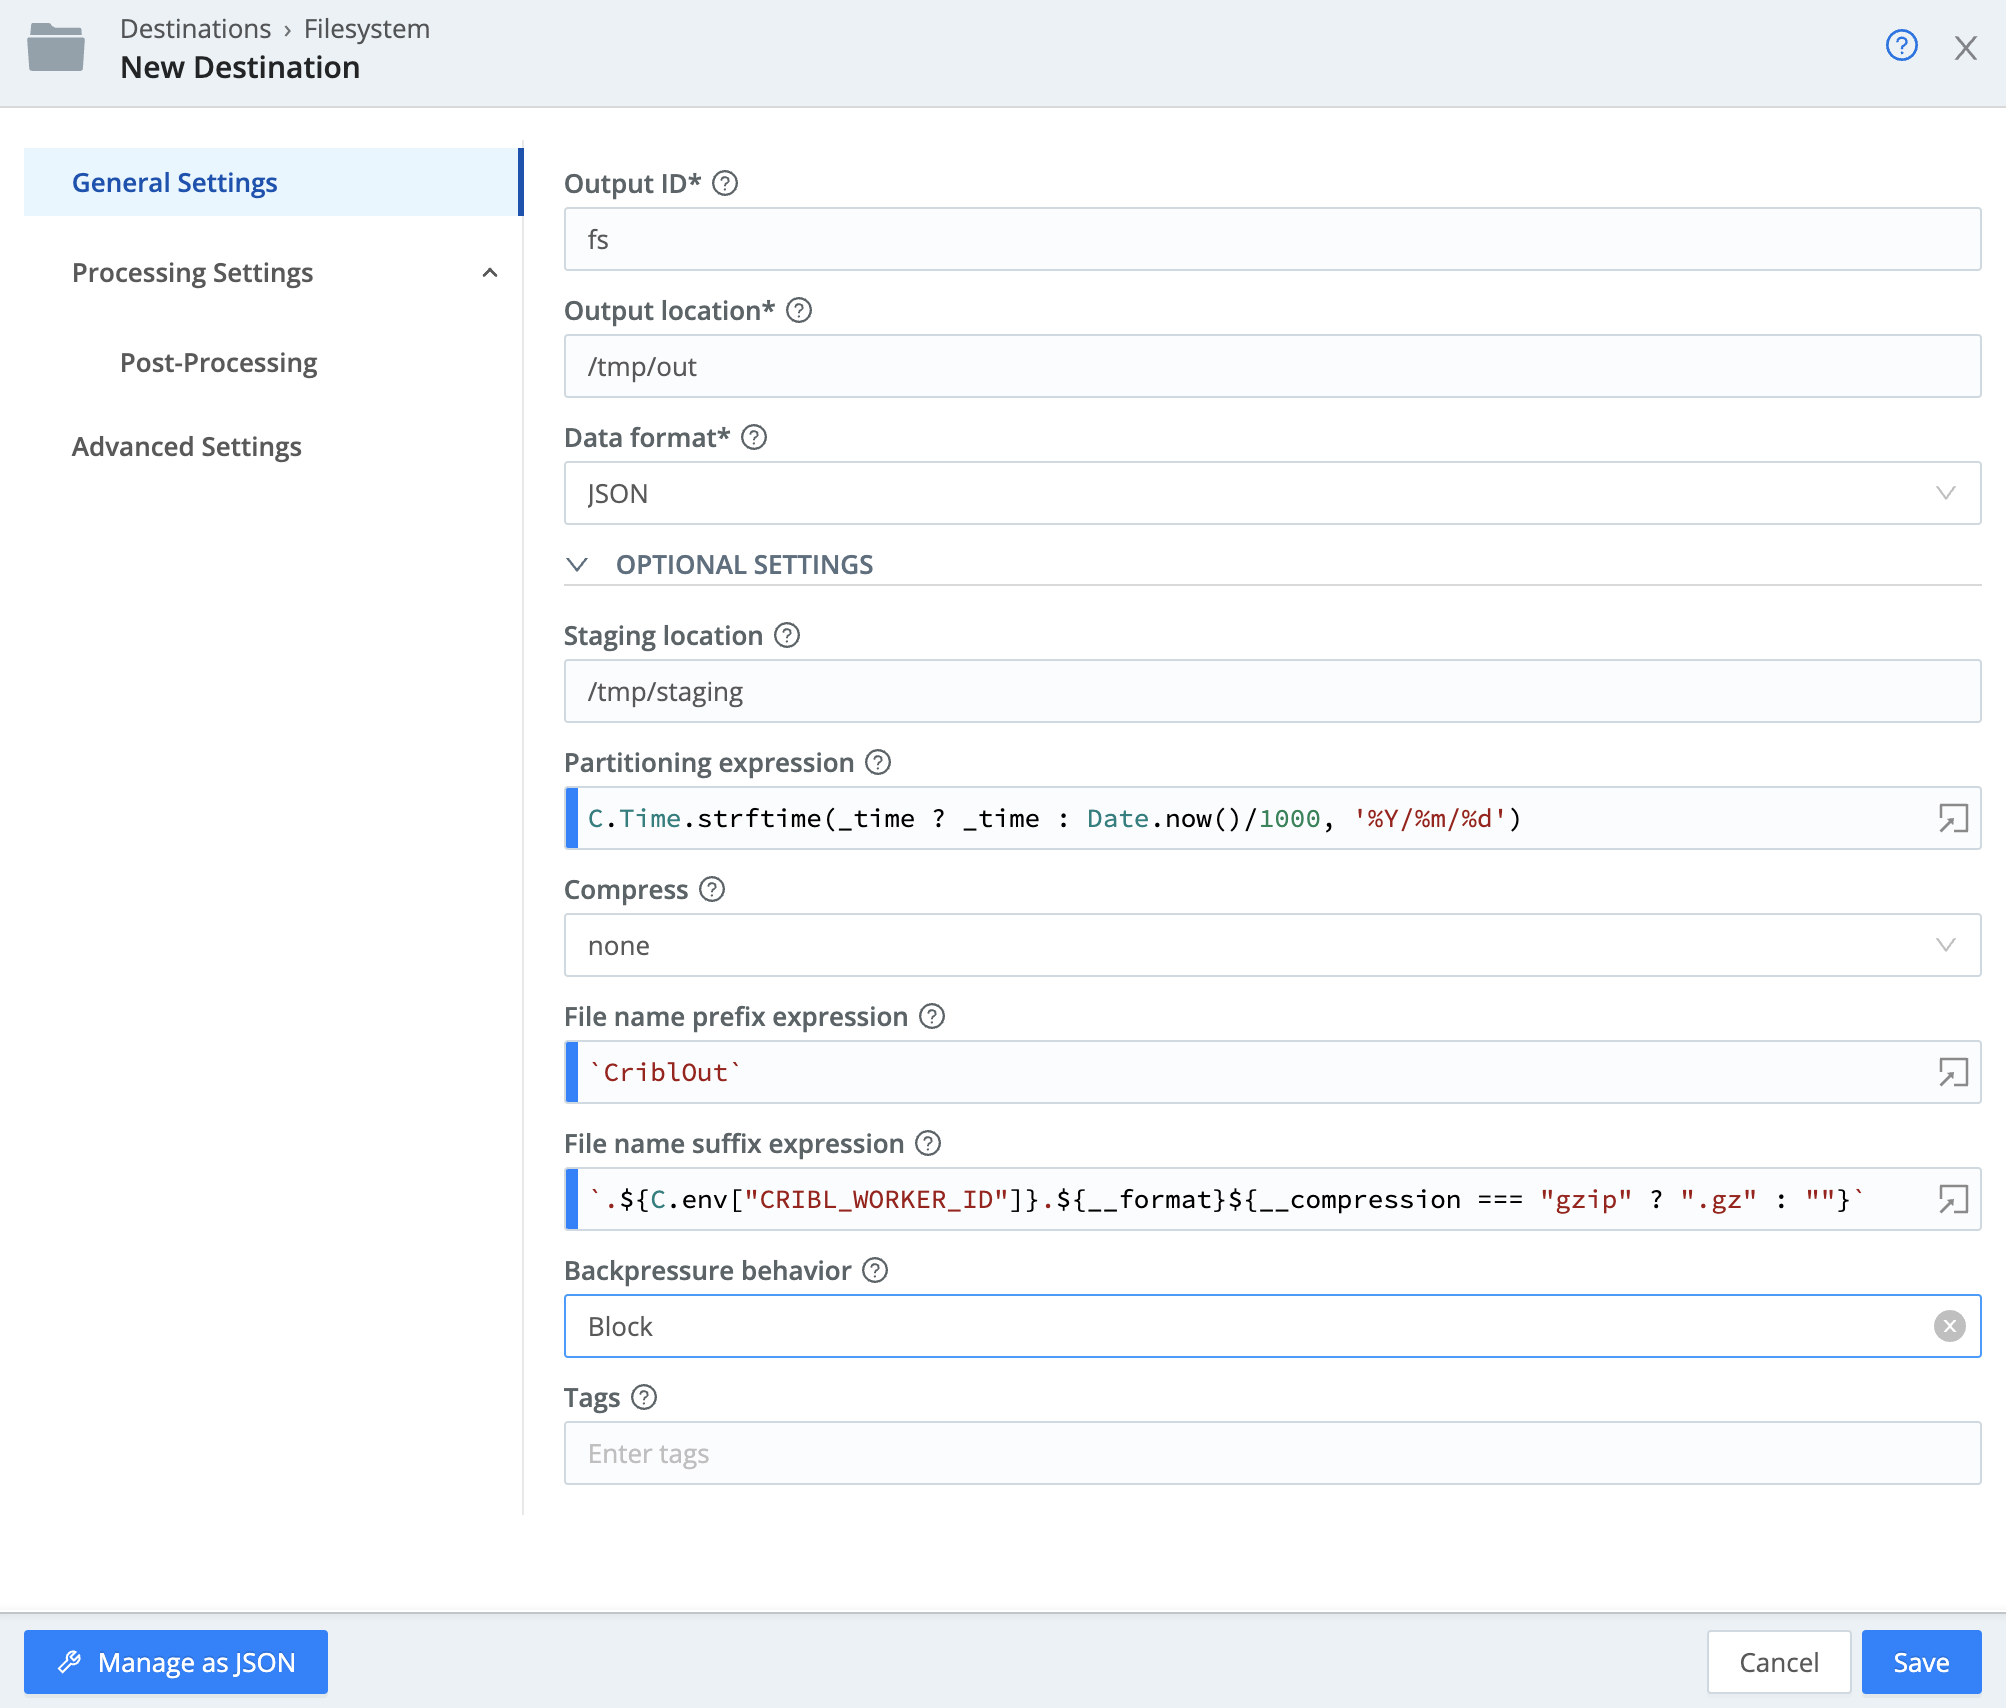
Output ID, putfs. - In
Output Location, put/tmp/out. - In
Staging Location, put/tmp/staging. - In the
Compressdropdown, selectNone.
Your fs Destination should look like this:
- Click
Save.
One other thing to note on this UI page is the Partitioning Expression. The Partitioning Expression is another JavaScript expression, used to determine the path to prepend to the filename. The entire directory structure will be created if it does not exist. This is also used in S3 and other outputs where the eventual reader of the data would like events segmented by the metadata available in the event.
In this case, we've used the default, which will put events into a file per unique combination of ${host}/${sourcetype}. This can get much more sophisticated, and usually we'll partition by time, as well as by a number of other metadata fields. Partitioning allows consuming systems to quickly rule out files they do not need to query, by looking at the directory structure before opening and scanning files.
We've added the output Destination, but next we need to add it to a Route so events will begin flowing to this output.
- Select the
Routingsubmenu at the top and clickData Routes. - In the
defaultRoute, click the...menu. - Click
Insert Route Above. - In the new Route's
Route Namefield, putfs. - Set the
Pipelinedrop-down topassthru. - Set the
Outputdrop-down tofilesystem:fs. - Click
Save.
Your Route should look like this:
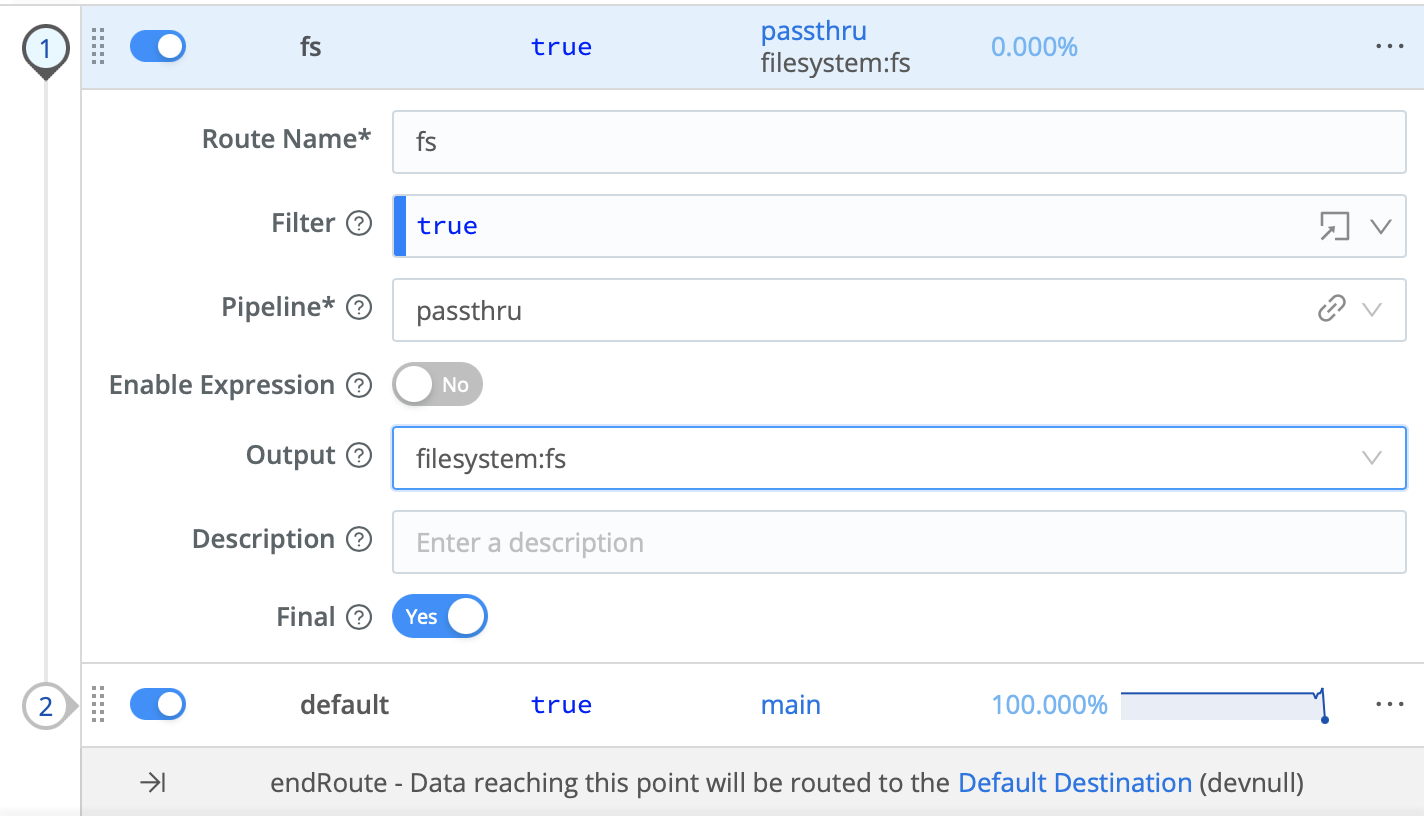
This should be pretty straightforward. We're creating a new Route, matching everything (with Filter set to true), and sending it unmodified – via the passthru Pipeline – to the filesystem.
The setting I want to focus on here is Final. Right now, Final is set to Yes, so all events are now heading out this output. You'll notice in the terminal below, assuming you're still running nc, that events have stopped flowing to the tcpjson output.
If you click through to Monitoring > Data > Destinations, you'll notice that events are now heading out the fs output and not the tcpjson output.

Let's validate that events are indeed flowing to the filesystem.
- In the terminal, type
^Cor (Ctrl-C) to kill anything running. - Once you get the command prompt, run this
tailcommand:tail -qf /tmp/staging/*/*/*/*/*/CriblOut*.json.tmp | jq .
You should see output similar to what you were seeing before with nc. However, by setting the fs Route's Final toggle to Yes, we are no longer getting output through our tcpjson output. This is because we placed its default Route below fs in the UI. Let's change that Final setting.
- Under
Routing > Data Routes, make sure your newfsRoute is expanded. - Set
FinaltoNo. - Click
Save.
After changing this, you should notice no data is being written to the file or to tcpjson. Why is this?
Once again, we're hitting "backpressure." Because we cannot push out the tcpjson output, events are failing to push to the filesystem as well. If you begin receiving the output from the tcpjson Destination again, you'll start to see events flow again.
- Type
^Cor (Ctrl-C) in the terminal. - Run
ncwith these options:/opt/cribl/bin/cribl nc -p 42000 -s 0 -o > /tmp/nc.log &
tail -f /tmp/nc.log | jq . - Wait, it can take a minute for traffic to flow.
- (Optionally:) Hide the terminal.
If you click through to Monitoring > Data > Destinations, you'll notice that events are now flowing out both Destinations.
What if we don't want to require tcpjson to be available? We can change that preference by changing the output's Backpressure Behavior in Destinations.
tcpjson Backpressure Behavior- Select the
Datasubmenu and clickDestinations. - Find and click
TCP JSONtile.
You can use the search box or theConfgured Onlycontrol. - Click the
tcpjsonoutput to expand it. - Change
Backpressure BehaviorfromBlocktoDrop. - Click
Save.
Events should now flow, whether or not we're listening for events on port 42000.
Next, in the Find & Replace section, we're going to create a Pipeline that will allow us to parse and transform events.