Aggregations
In this section, we'll implement Aggregations on our stream. Aggregations can be a great way to minimize data volume, and also greatly enhance the performance of Destination systems, by performing analytics in the Pipeline.
Aggregations perform calculations on the stream of data and emit outputs of those calculations every window of X seconds. Aggregations are frequently used with time-series databases, to convert log data to metrics for faster queries and more-affordable storage.
be_big.log CaptureDo the following if you're not still in the Pipeline view and Preview.
- With the
Managetab active in Stream's top nav: - Select the
Processingsubmenu and clickPipelines. - Click
business_event. - Click
Sample Datain the right pane. - Click
Simplenext to thebe_big.logcapture.
- Click
Add Function, then search forAggregationsand click it. - Scroll down and click into the new
AggregationsFunction. - For
Filter, type:sourcetype=='business_event'
Aggregations run over a specific Time Window, which we've left at the default of 10s for now. The Aggregates field takes a list of aggregation expressions.
Aggregation expressions are another type of JavaScript expression in Stream, with their own expression syntax. Aggregation expressions allow you to run calculations against fields in the event, and we ship with a number of Functions, like count, avg, min, max, perc and other statistical Functions. See the docs for a full list.
For our example, we're going to be aggregating the planPrice field, with a number of aggregations grouped by a number of dimensions. Place your cursor into the Aggregates field. As you're typing in the Aggregates field, you should notice typeahead showing you the available Functions.
- With your cursor still in the
Aggregatesfield, entercount(). - For each remaining aggregation below, click
Add Aggregateand add the corresponding aggregation on its own row:avg(planPrice)min(planPrice)max(planPrice)perc(50, planPrice)perc(95, planPrice)
- Paste the following into
Group by Fields:phoneCode,phoneName,phoneType,planCode,planName,planType - Click
Save.
As you can see, we've added a reasonable number of aggregations for the planPrice field. Without having the raw data, this should give us enough information to get a reasonable approximation of what the original data contained.
Let's look at the right Preview pane. Assuming that its Show Dropped Events slider is enabled, you'll notice that all of your events got dropped! The default with Aggregations is to create a new set of aggregation events, and drop the original events. You can change this behavior, if you need to, by opening the Aggregations Function's Output Settings section and enabling the Passthrough Mode slider. For now, let's clean up preview by turning off Show Dropped Events.
Show Dropped Events- In Preview, next to
Select Fields, click the gear icon () and turn offShow Dropped Events.
You should now see events in a shape like this:
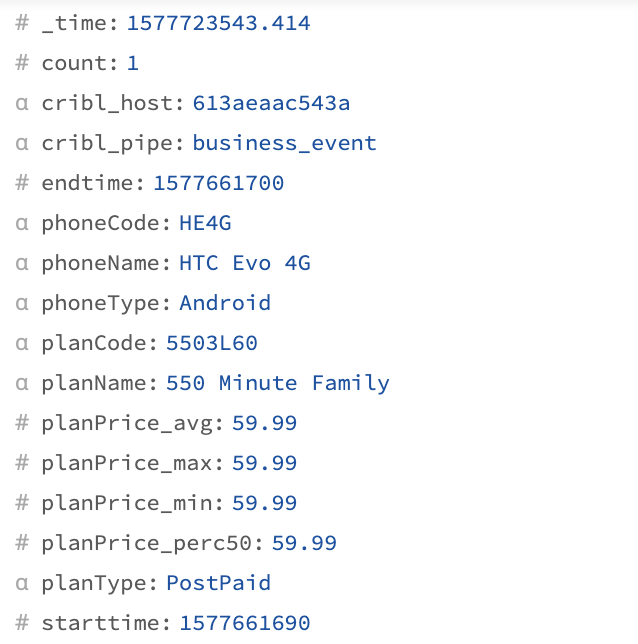
As you can see, these are completely reshaped events. Fields whose names you've specified in Group By Fields become fields in the new event, and we output a column for each aggregation. In this particular example, as you scroll through, note that most of the count values are 1, meaning we didn't really save much in terms of the event count. If you click on the Graph icon (Basic Statistics) next to Select Fields you can see statistics.
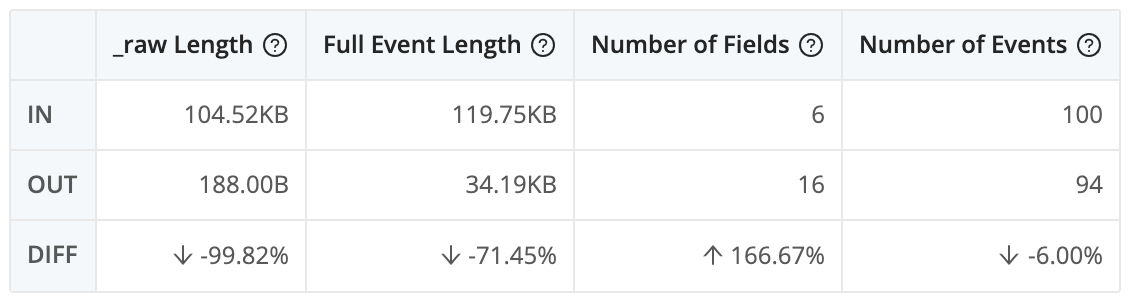
Because our events are not nearly as wide as the original, and contain a smaller number of fields, we've shaved about 70% off of the byte count in Full Event Length. (Ignore the _raw Length column, because there is no _raw field.) However, our event count only decreased by about 6, because we are outputting an event every 10 seconds for every phoneCode and planCode. (The phoneName and planName fields have a 1:1 relationship with phoneCode and planCode.)
This is, however, very misleading. In our example capture, we captured 100 seconds' worth of data. But our aggregation Function does not run based on event time, but rather based on when it sees the events. In Preview, we are aggregating 100 seconds of events as if they had arrived in a 10-second window.
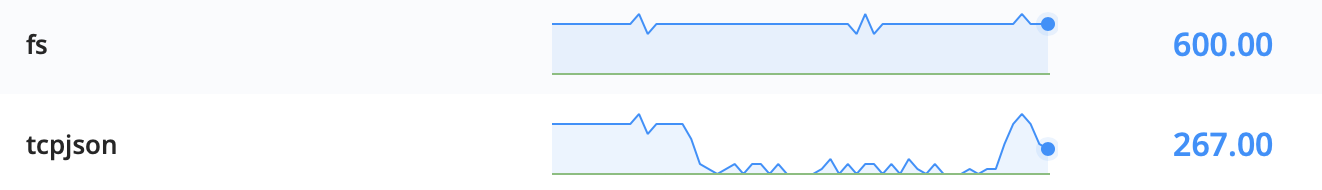
A more reliable indicator is to look at the stream itself. If you go to Monitoring > Data > Destinations, you should get more accurate representations of event counts, like this:
There are a couple of ways to further reduce the volume. First, we don't need 10-second resolution.
- In the
AggregationsFunction, changeTime Window(between theFinalslider andAggregatessection) to30s. - Click
Save.
This won't impact what we're seeing in Preview, but it should start to impact the event counts on the Monitoring tab. Because we're using fake data, we'll see the same 100 events every 100 seconds, so this change doesn't impact our event counts much. But in the real world, this should offer 2x to 3x savings by widening the window.
The second option we have is to reduce the cardinality of the data.
- Under
Group by Fields, remove the high-cardinality fieldsphoneCode,phoneName,planCodeandplanName - Click
Save.
In Preview, you should see the number of events drop drastically, to about 25% of the original event count. In the Monitoring tab, over the next few minutes, you should start to see the number of events output to the fs Destination start to be significantly higher than those sent to tcpjson. In the terminal, you should be seeing significantly fewer events, emerging only every 30 seconds.
If you're not seeing any output, run the following command in the terminal:
tail -f /tmp/nc.log | jq .
Metric Events
One last thing to highlight about the Aggregations Function is that Stream treats metric events in a special way. Data that comes in from metrics Sources, like StatsD or Graphite, contains metadata in each event. We use this metadata for outputting to metrics Destinations, including metrics indexes.
Suppose you want to convert log/event data to metrics, and output to a metrics index – or to any other metrics Destination, like StatsD or Graphite. In this scenario, you'll want to open your Aggregations Function's Output Settings section and enable Metrics Mode.
If you do this now, in Preview, click the gear icon () next to Select Fields, and turn on Show Internal Fields. With Metrics Mode enabled, you should see a new internal field specified on each event, called __criblMetrics, which helps Stream properly output the event to Metrics Destinations.
__criblMetrics will only show up if you enable Metrics Mode in the Aggregation function under the Output Settings section and click Save.