Threat Feed Lookup
Now we need to add the compromised IP info to our data. This lookup is a little different than a regular CSV-based lookup. In most cases, you're looking for a specific value in one field of the CSV, in order to return one or more result fields from the same line as the match.
This compromised-ips.csv file has just a single field – it's basically just a list of IP addresses, and we only want to check if the field value we're passing in exists somewhere in the file. Instead of using a Lookup Function, we're going to use an Eval Function with a C.Lookup().match() expression.
- Click the
Criblupper tab. - If you're not already there, select
Managefrom Stream's top nav, then selectProcessing>Pipelinesfrom the submenu. - Find and click the
firewall_enrichPipeline. - If you need to refresh your events' display in Stream's right pane: Again click
Simple(at the lower right, to the right of thepan_firewall_traffic_conditioned.logsample file), and then click theOUTbutton at the top of the right pane. - Click the
Add Functionbutton near the top of the left pane. TypeEvalinto the search box, and click theEvallink to add this Function. - Scroll the left pane to the bottom, and click into the new
EvalFunction. - Under
Evaluate Fields, click+ Add Field. Putcompromisedin theNamefield, and copy/paste the following into theValue Expressionfield:C.Lookup('compromised-ips.csv').match(src_ip) ? true : false - Click
Save.
This C.Lookup().match() Function checks if the IP address contained in src_ip is present in the lookup file. It returns true if so, false if not. The result is that a new compromised field will show up in every record, with a value of either true or false 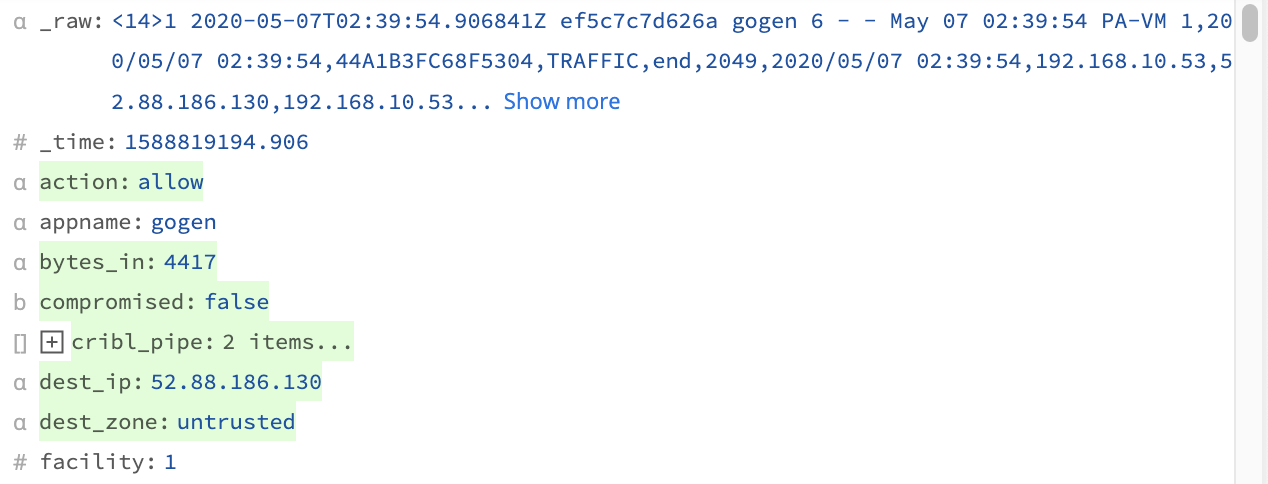 .
.
Let's take a look at the results...
- Click the
Kibana - Eventsupper tab, and hitRefreshto see the most recent events. If you expand the first event, you should see a new field namedcompromised. - Click the
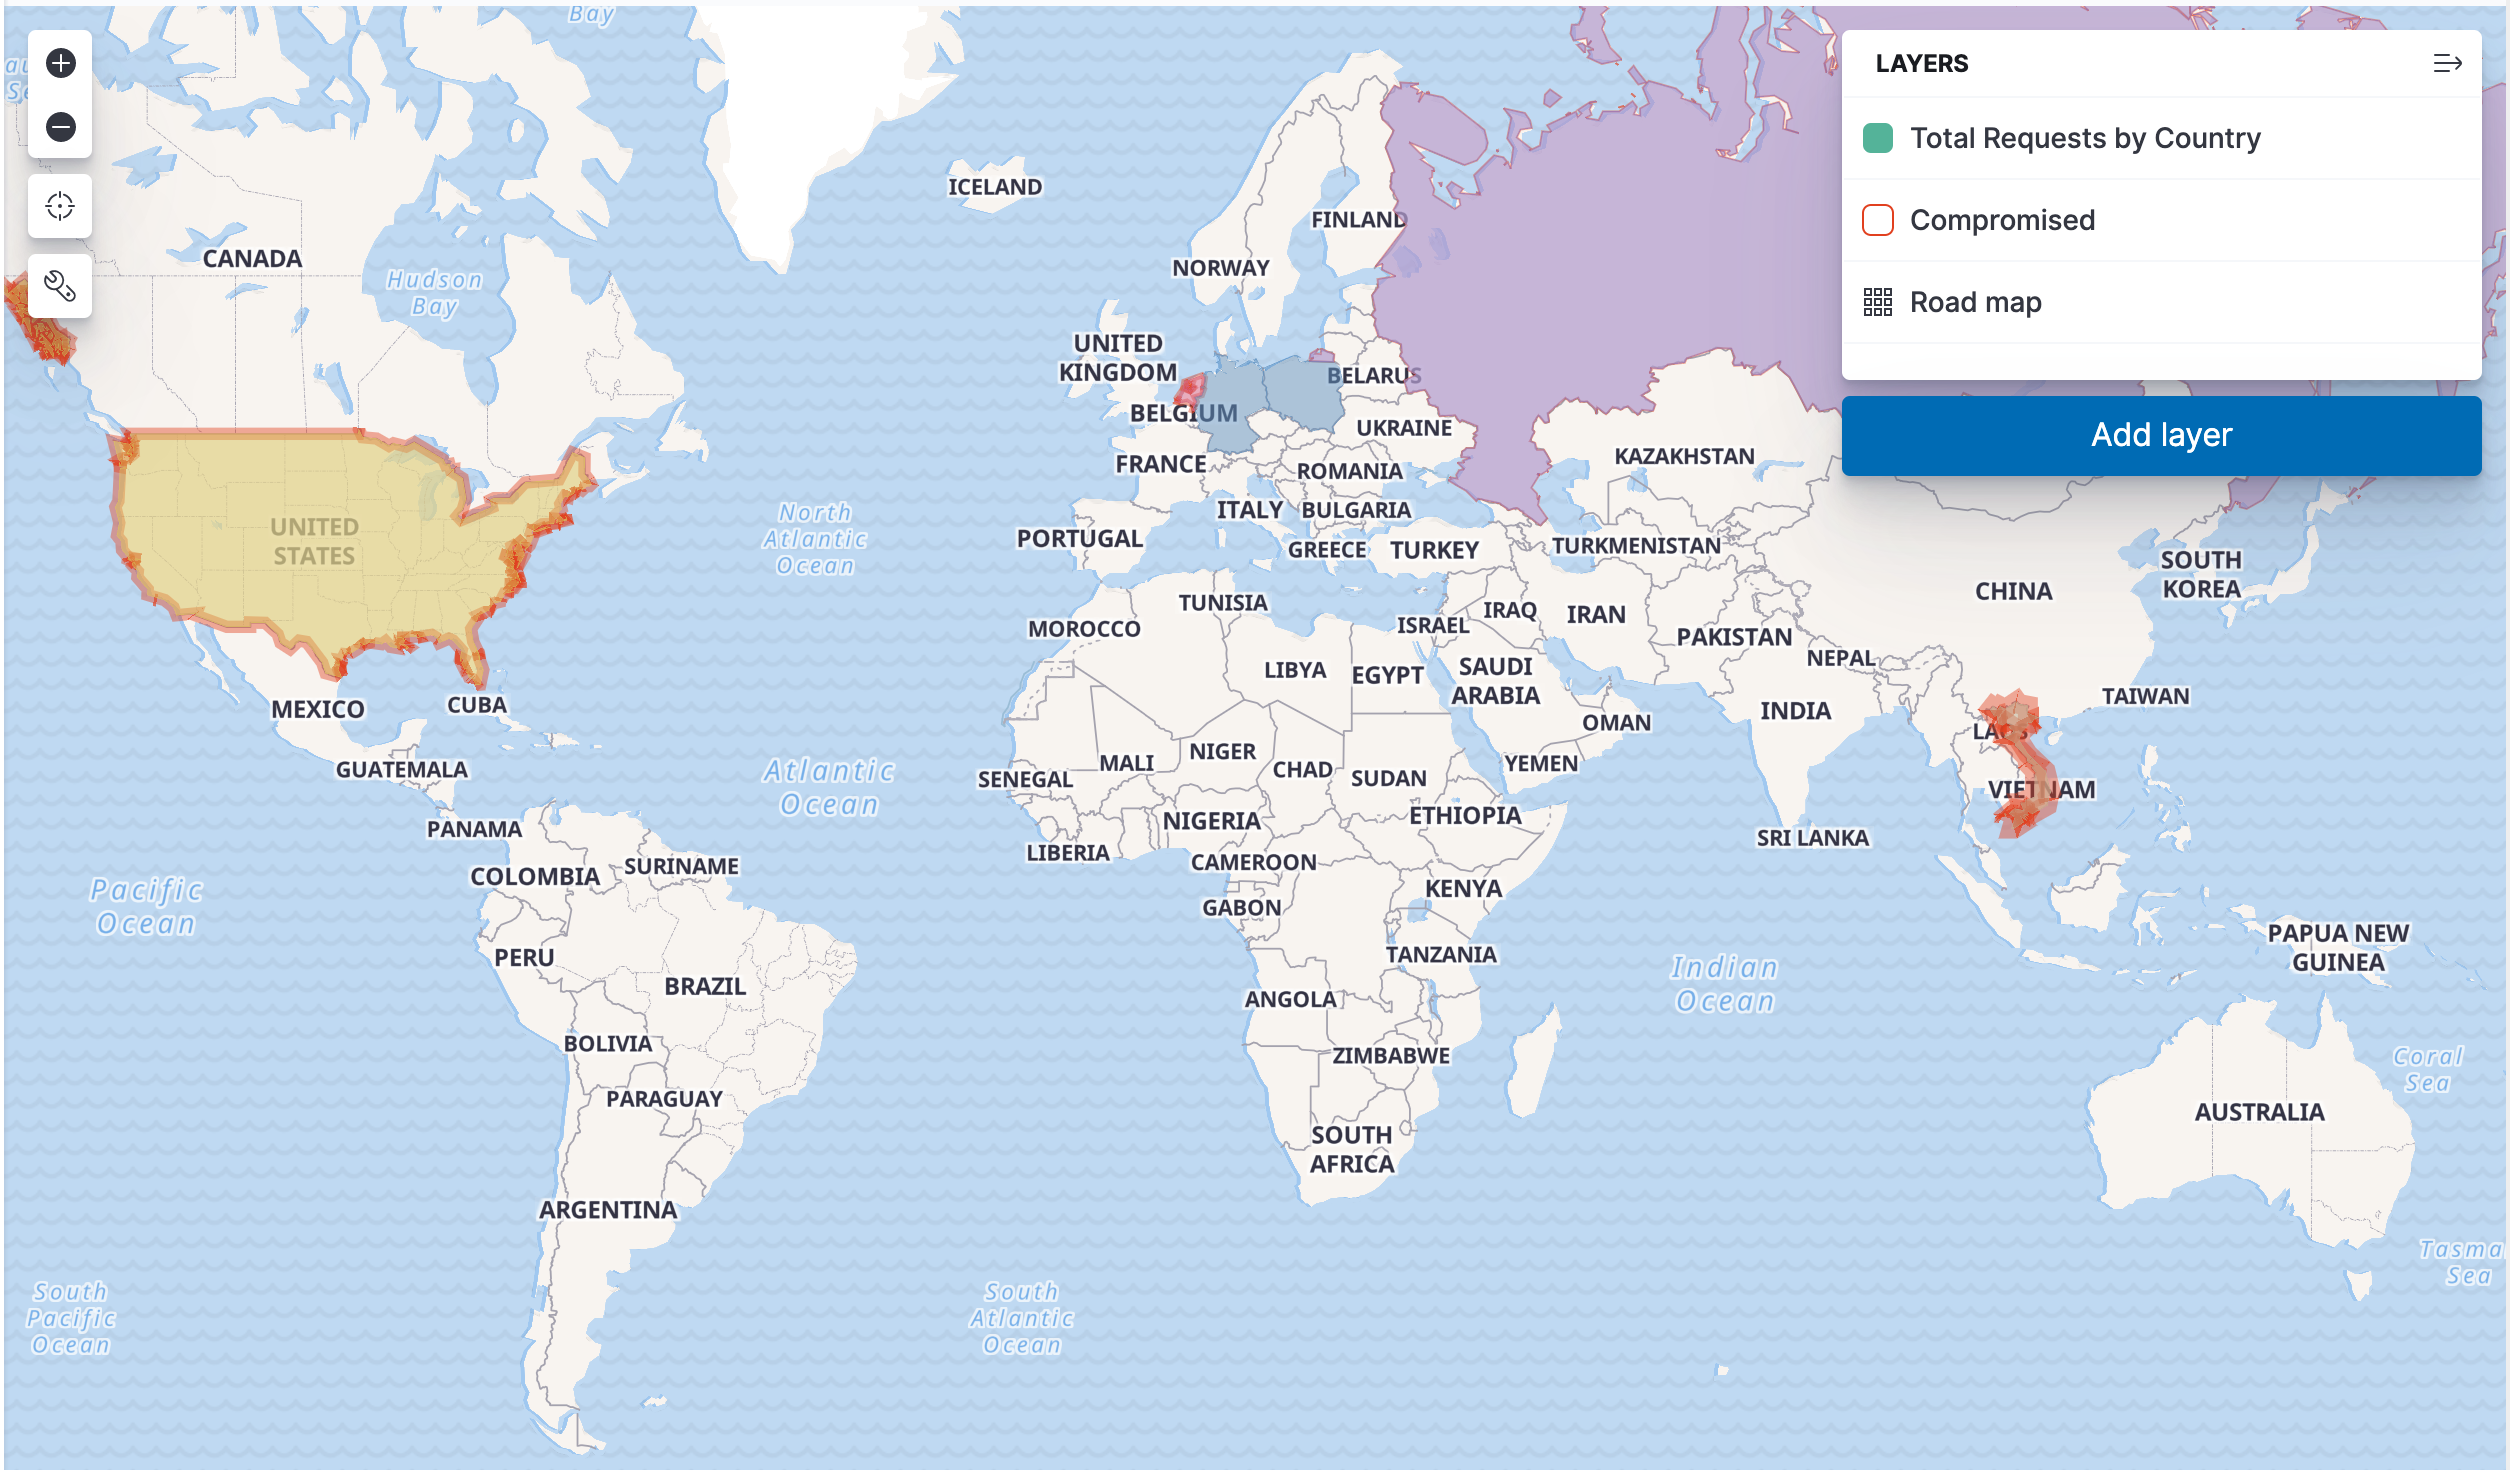
Kibana - Mapupper tab, and hitRefreshto map the most recent events.
You should now see a red border appear around any country that is sending traffic from a compromised IP address. The thickness of the border reflects how many events from compromised IP's are coming from that country. It will look similar to the image below (with some variation, due to the variability of the data).