GeoIP Lookups
Now that we have a GeoIP database in place, we can configure a Stream Pipeline to execute the lookup. We're going to add a GeoIP Function to the firewall_enrich Pipeline.
-
Click on the
Criblupper tab (if it doesn't have focus). -
In the Stream UI's top nav, make sure
Manageis active. -
From the submenu, select
Processing>Pipelines. -
On the
Pipelinespage, find and click on thefirewall_enrichPipeline. (To display this first column's header and contents, you might need to drag the pane and column dividers toward the right.) -
In the Stream UI's right pane, make sure
Sample Datahas focus. Then click onSimple(at the lower right), to the right of thepan_firewall_traffic_conditioned.logsample name. -
Click the
OUTbutton toward the top of the right pane. You should see 50 pan:traffic events, with green highlights for fields the Pipeline is adding in that pane, like this: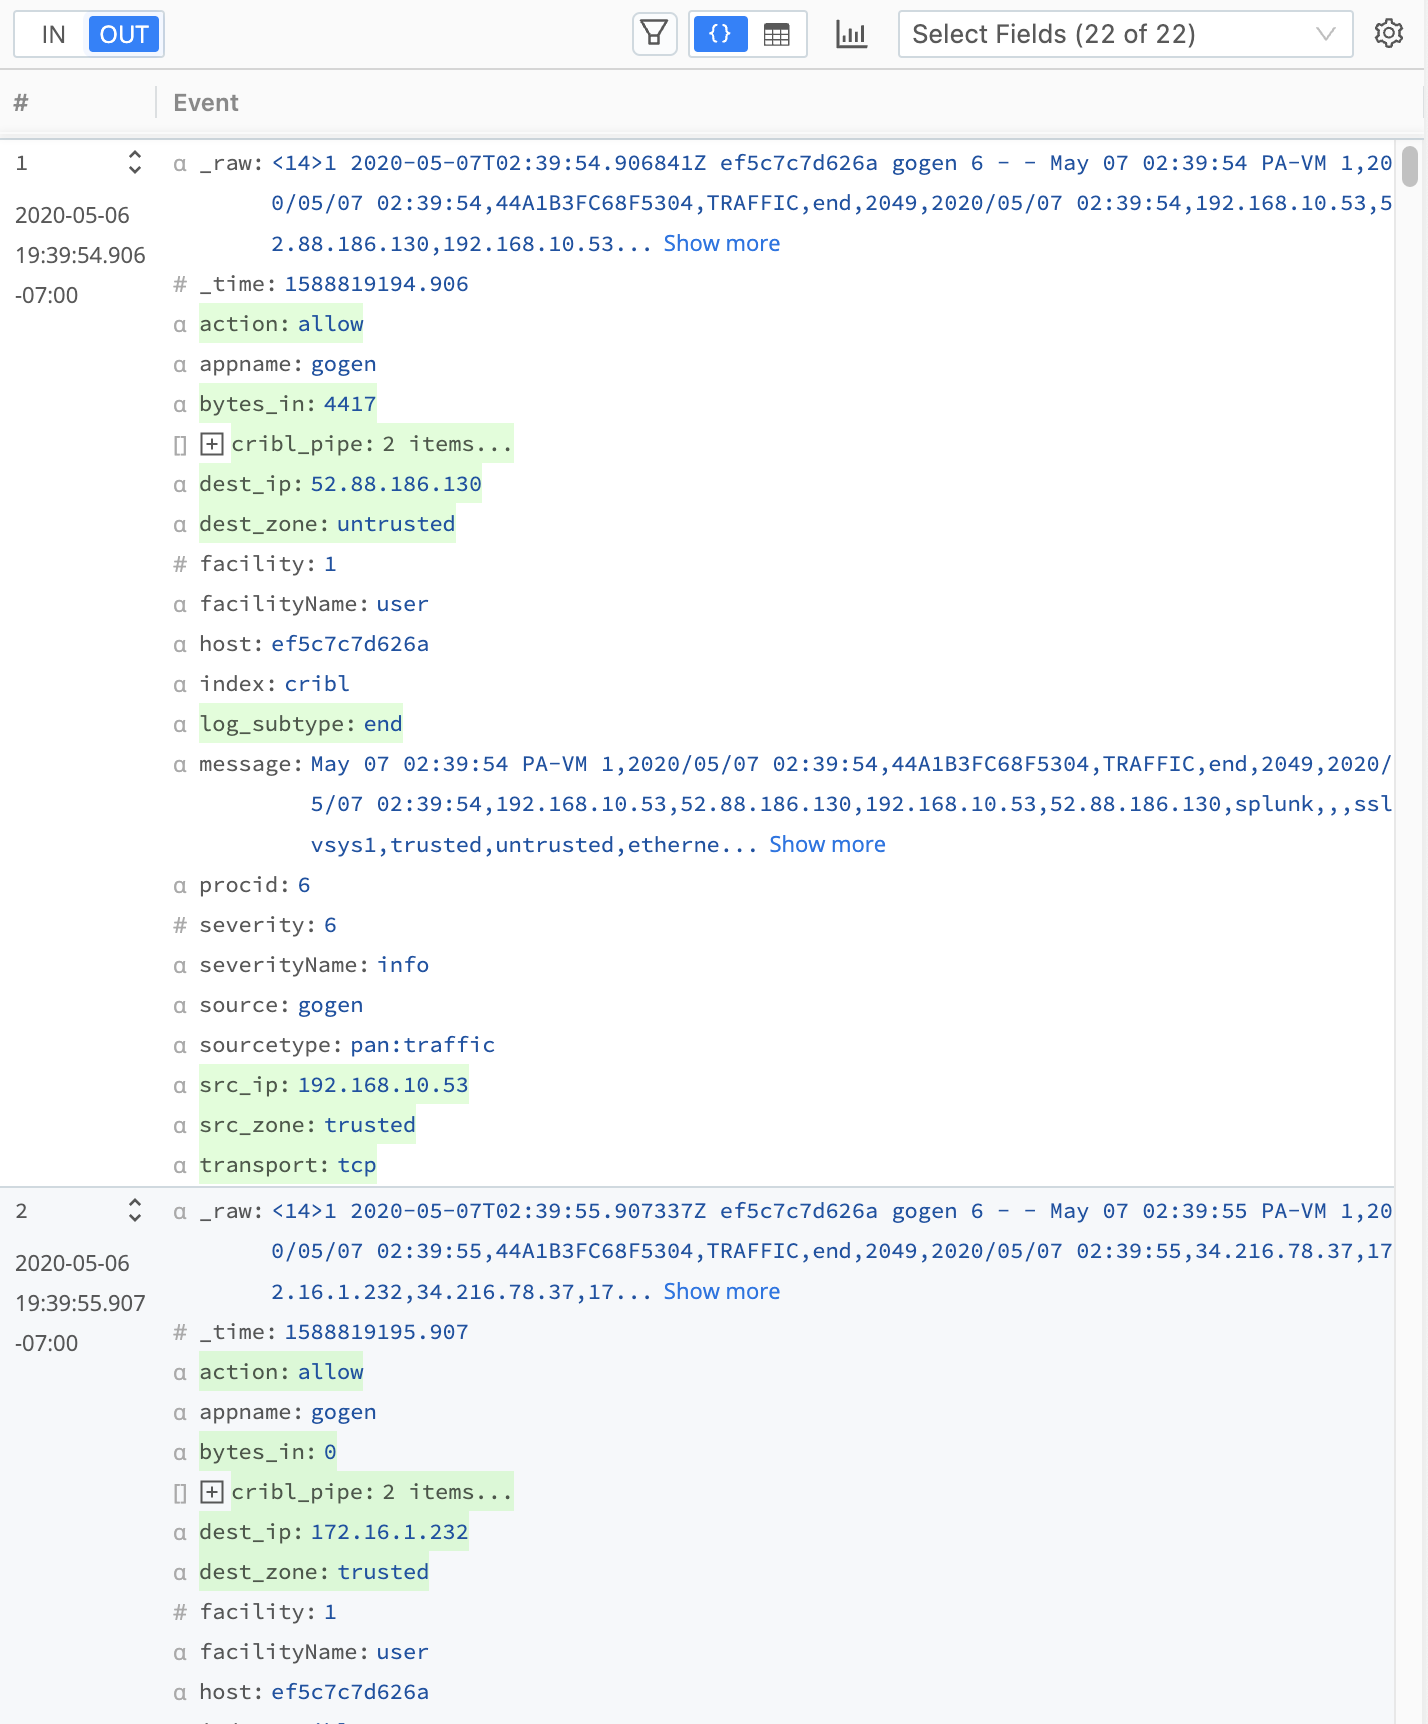
-
Click
Add Functionnear the top of the left pane, and either findGeoIPin theStandardsubmenu, or typeGeoIPinto the search box to Locate it. Then clickGeoIPto add this Function to the Pipeline. -
In the new
GeoIPFunction, enter the following field values:Field Value GeoIP File (.mmdb)GeoLite2-City.mmdbIP Fieldsrc_ipResult Fieldsrc_geoipThe Function should look now like this (we've added an optional
Descriptionvalue):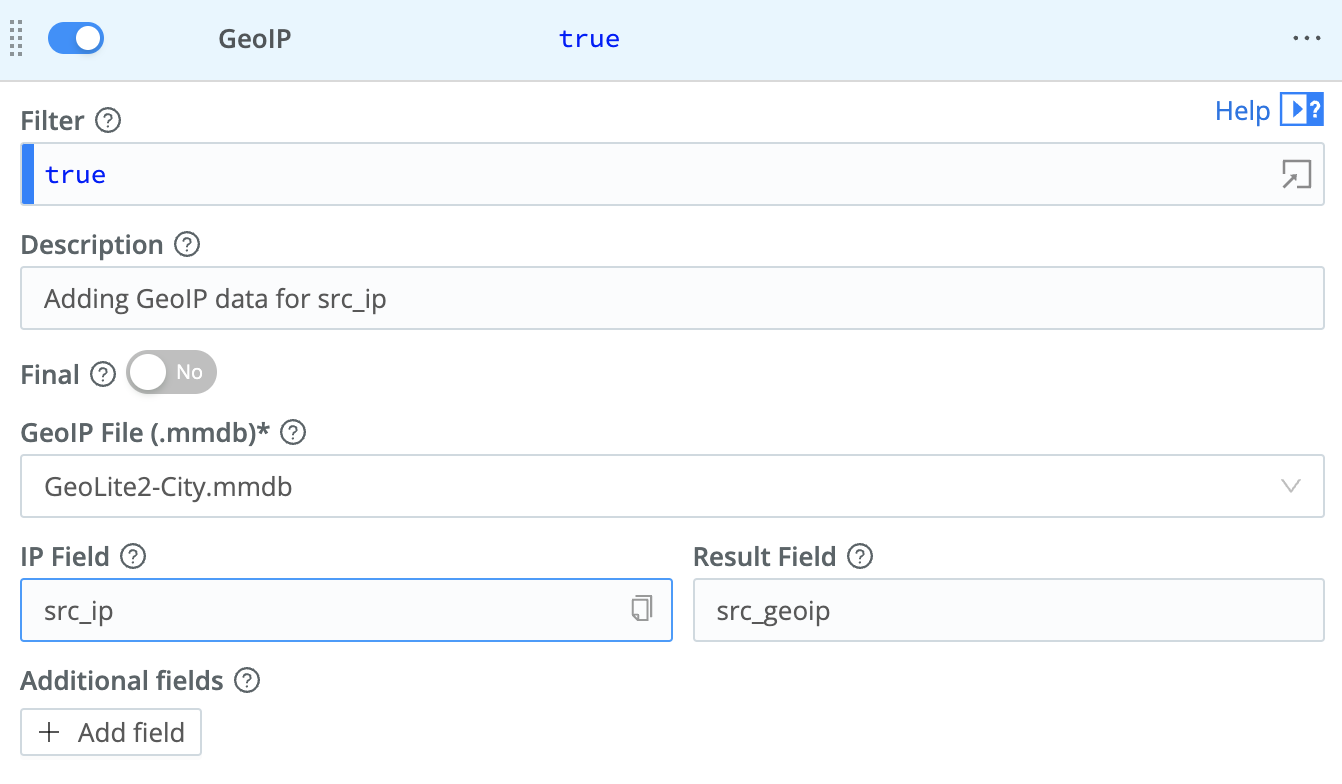
-
Click
Save.
Records in the right output pane should now display a new src_geoip field: if the src_ip field value is a private address (aka rfc 1918 address space), it will show as a null value, otherwise it will be a json object. You can click any src_geoip field to expand its multiple nested fields.
At this point, the data that is going to the Elasticsearch/Kibana environment is also enriched with the src_geoip field. Let's take a look.
- Click the
Kibana - Eventsupper tab, and hitRefreshnear the top of the embedded Kibana frame to see the most recent events. If you expand the first event, you should see a series of fields whose names start withsrc_geoip.. - Click the
Kibana - Mapupper tab, and hitRefreshnear the top of the embedded Kibana frame to map the most recent events. You should now see a number of countries change color. If you hover your mouse over any of them, you'll see a tooltip telling you how many events came from that country.
If you get lost in the Kibana interface, click the expansion icon at the bottom left of the Kibana UI, and it will show you the full navigation.
Our Compromised Layer is still showing no data, so next, let's get the threat feed enrichment going.