Course Overview
Firewall logs are a very rich source of data, but often, one needs to add external context to make them more useful. A firewall log event will give you IP addresses, TCP/UDP port numbers, and policy actions, among other things. Many times, you want to look at that traffic more holistically and add external data – like Geospatial info based on IP addresses, or whether an IP address matches a reported bad actor in a threat feed.
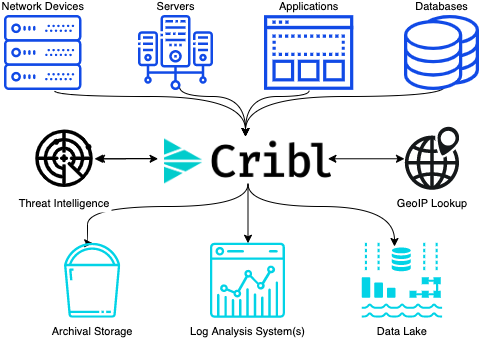
Cribl, the Data Engine for IT and Security, empowers organizations to transform their data strategy. Customers use Cribl to collect, process, route, and analyze all IT and security data, delivering the flexibility, choice, and control required to adapt to their ever-changing needs.
This course will start with sample Palo Alto Networks firewall logs generated via a datagen input. We'll walk through enriching the data using the MaxMind GeoIP database, and will look up IP addresses against the Compromised IPs list from the Emerging Threats open-source feed (published by Proofpoint). We'll explore the data, and also plot it on a map via Kibana/Elasticsearch.
If you are running the Brave browser, or ad blocker software in other browsers, you'll need to disable blocking for this sandbox (and for working with data collection in the Cribl Stream UI). Please do this before proceeding.
Let's get started!