Kube State Metrics
You'll now use a stock Grafana dashboard to visualize the data collected from the Kubernetes Metrics Source. This Source is identical to the data that is collected by Kube State Metrics (KSM).
important
- From the navigation menu, select the Dashboards link to the left of Loki Logs.
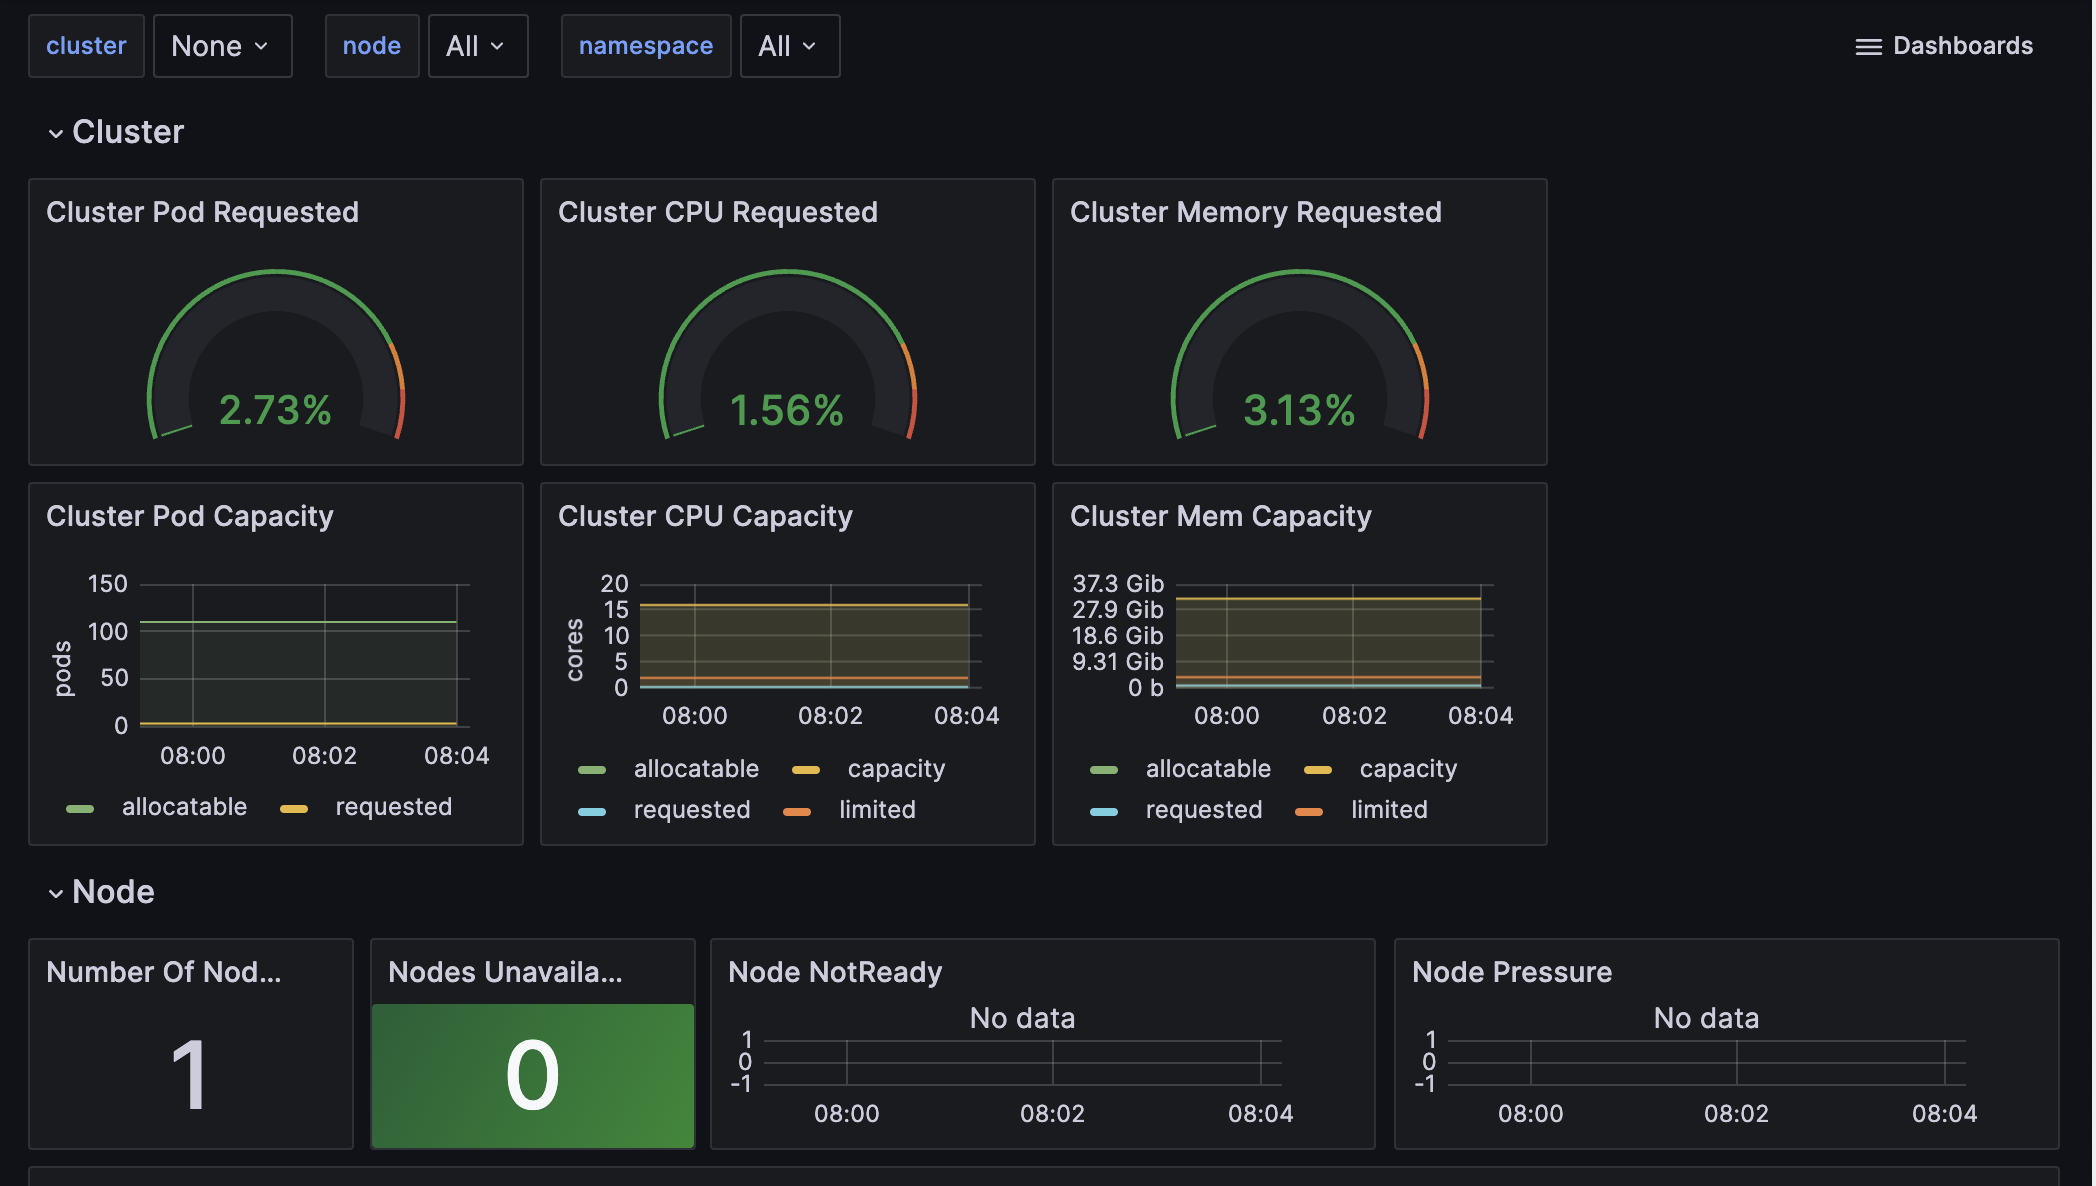
- In the General section, select the kube-state-metrics-v2 dashboard.
- In the top right, select the time range (24 hours) and change it to last 5 minutes.
Feel free to explore this dashboard more.
Conclusion
This concludes the Sandbox. You did it! You deployed Cribl Edge on Kubernetes, collected useful data, and visualized it in Grafana. We designed Cribl Edge with feedback from our customers, to help them improve their visibility in Kubernetes environments and do this at scale.
Once you're finished in Grafana, continue to the next page.