Grafana Overview
Grafana, a data visualization suite, lets you search popular open-source services such as Loki and Prometheus. In this section, you can view the data collected from Cribl Edge.
Exploring Kubernetes Events
To find data in Grafana, you can use the Explorer. Follow along to find the Kubernetes Events.
important
- Click the Grafana tab at the top of the screen to switch to Grafana.
- Click the "hamburger" icon (three horizontal lines) below the Grafana logo to open the menu.
- Select Explore from the menu.
- From the data source drop-down list, select Loki if it is not already selected.
- In the label filters configuration, add a new filter. Configure the filter:
source = cribl_kube_events:in_kube_events - Click the + Operations button.
- Select Formats >
JSONfrom the drop-down list. - Click the Run Query button in the top right of the screen. (Note: It may look like a circle with two arrows.)
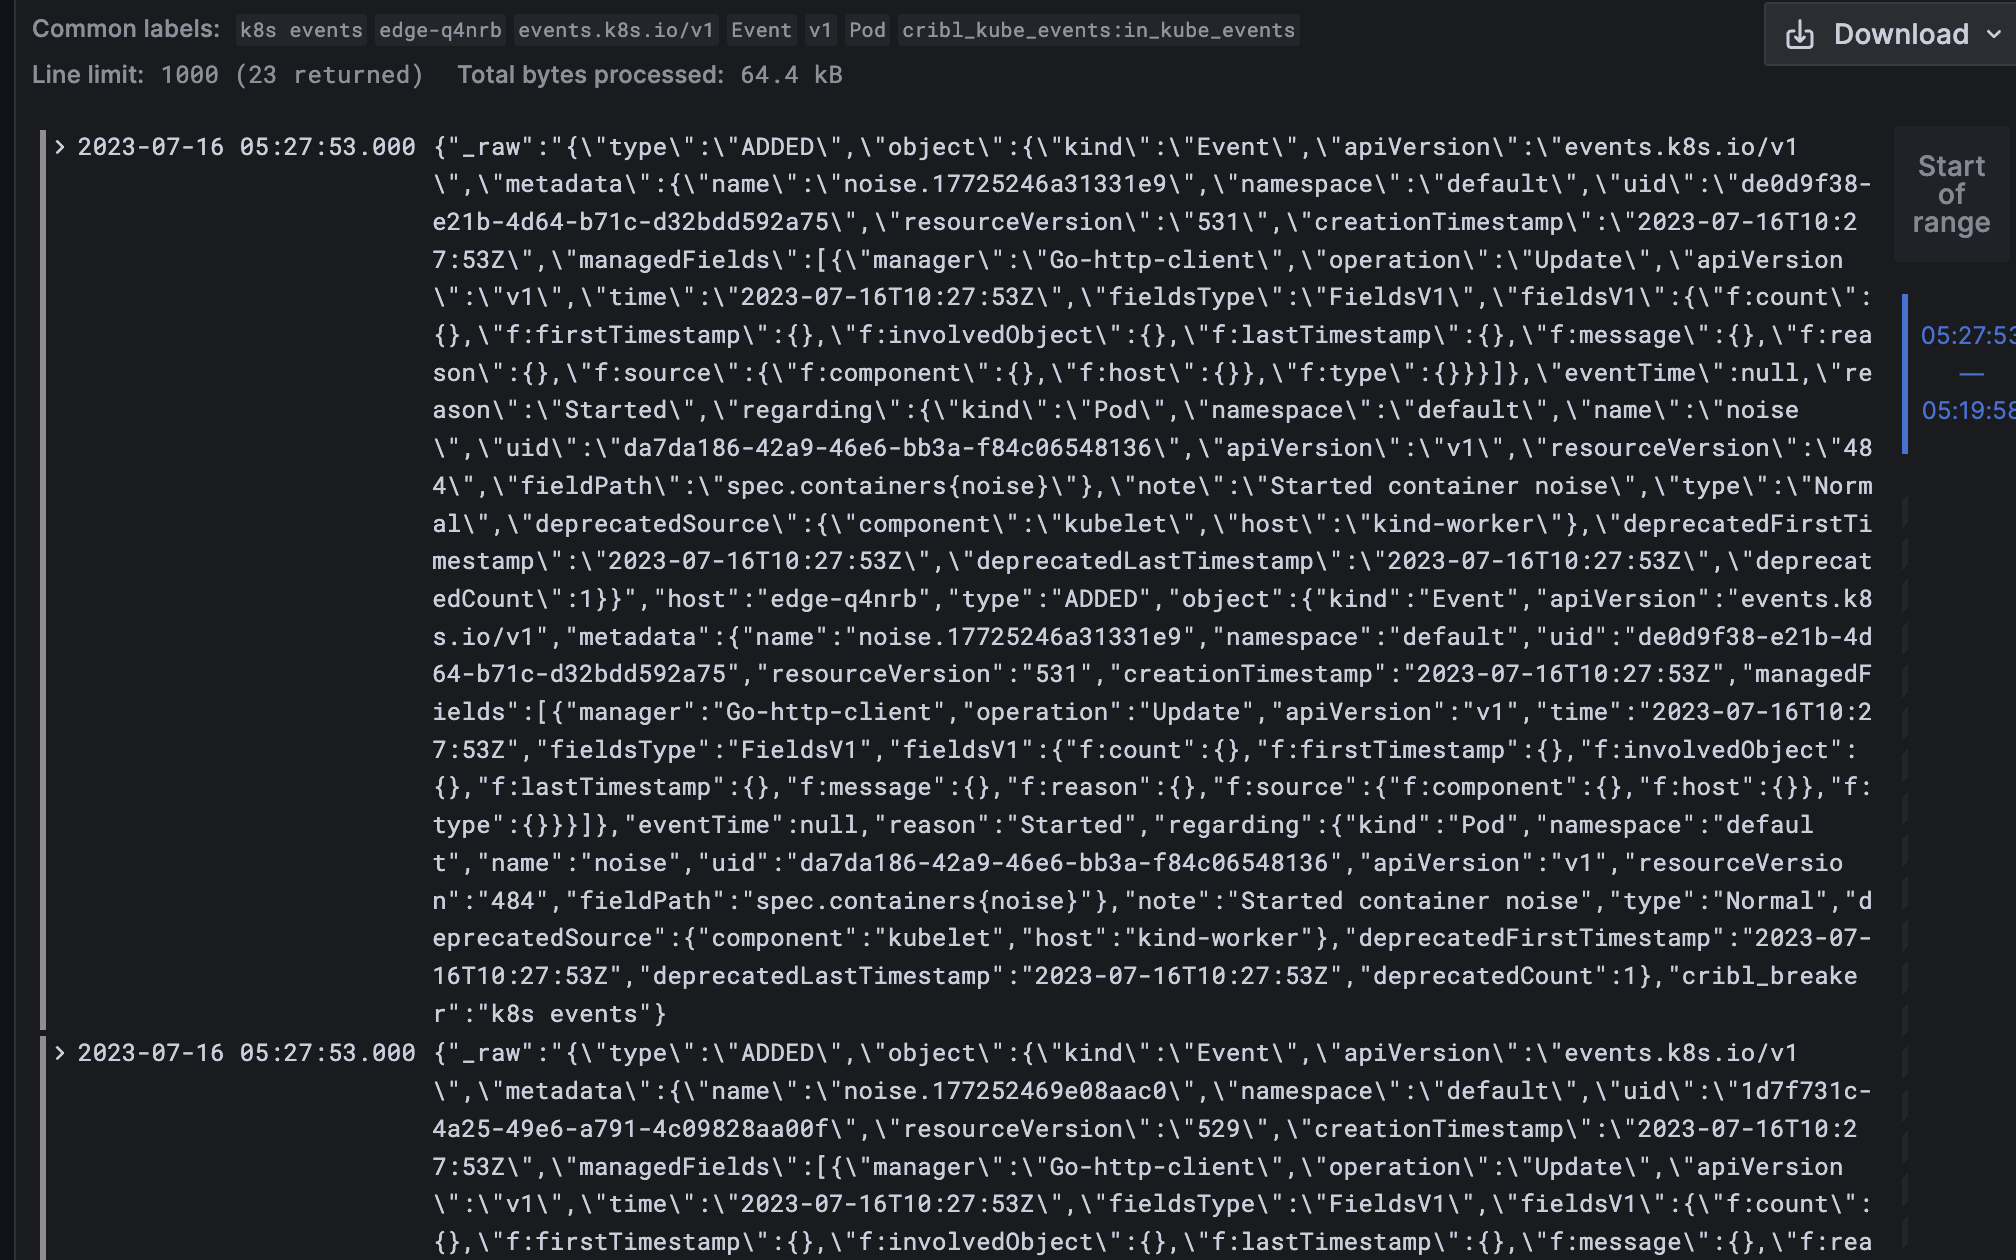
tip
If you don't see any events, you might need to adjust your time range.
Exploring Kubernetes Metrics
Now that you've found the events, you can view scraped metrics from Prometheus!
important
- Change the data source dropdown from Loki to Prometheus.
- Click the trash can icon in the top right of the Prometheus configuration to delete the old Loki query.
- Click the + Add query button.
- From the Metric dropdown, select the first entry:
cadvisor_version_info - Click the Run Query button in the top right of the screen. (Note: It may look like a circle with two arrows.)
While this metric isn't very exciting, you can see that the data scraped from the cadvisor_metrics source is being populated in the Prometheus instance that Grafana is querying.
Feel free to explore more metrics in this view. Once you're ready, we'll explore some more structured dashboards.