
Welcome to Cribl Stream
For this section, we're going to look at Sources and Destinations in Cribl Stream. By the end, we'll have real events flowing through Cribl Stream, and we'll validate them using industry-standard tools like netcat.
First, let's explain a bit about our environment. We are running a single-instance version of Stream. There is a data generator, built into the product, generating 1 event per second. Currently, our only configured output is DevNull, a built-in output that simply drops events.

Let's take a look at Sources.
important
Open HTTP Source
- Make sure the
Managetab is active in Stream's top nav - Select the
Datasubmenu and clickSources. - Click the
HTTPtile. - Click on the
httpSource.
Stream supports a number of different wire protocols for data, like Splunk, syslog, Kafka, StatsD, and many others. You can see a full list of types in Stream's left navigation. Stream ships by default with an HTTP Source enabled on port 10080. This supports the Elasticsearch Bulk Ingestion API, which can be used by Beats or Fluentd, and also supports Splunk's HTTP Event Collector format.
On our HTTP Source, you can see that we present a number of different configuration options, including Address, Port, the ability to add authentication tokens, endpoints for Elasticsearch and Splunk HEC, TLS options, and more. Our defaults will work for most of these settings, but the HTTP Source shows you that for each of the protocols we support, there is rich configurability. We also have a second Source configured, a Datagen Source, which is producing data on a regular interval for our sandbox.
You can see the current throughput by clicking on Monitoring in the top nav. In the left Events In and Out graph, you should see one event per second coming in, and the same number going out. Let's add a more interesting Destination than Stream's default DevNull!
The first Destination we're going to add is a simple TCP output, which will send newline-delimited JSON documents on that TCP port. Cribl uses this simple protocol to communicate between Stream instances, and it's also easy to use for testing. In production, you'll likely be using Destinations like Splunk, S3, and Kafka.
In our shell at the bottom right, we're going to use nc as a listener to receive data on our tcpjson output. We'll also be able to validate that we're seeing events in the terminal.
important
Add TCP JSON Destination
- Select the
Datasubmenu and click onDestinations. - On the resulting page, locate and click on the
TCP JSONtile.
You can use the search box to find it. - Click
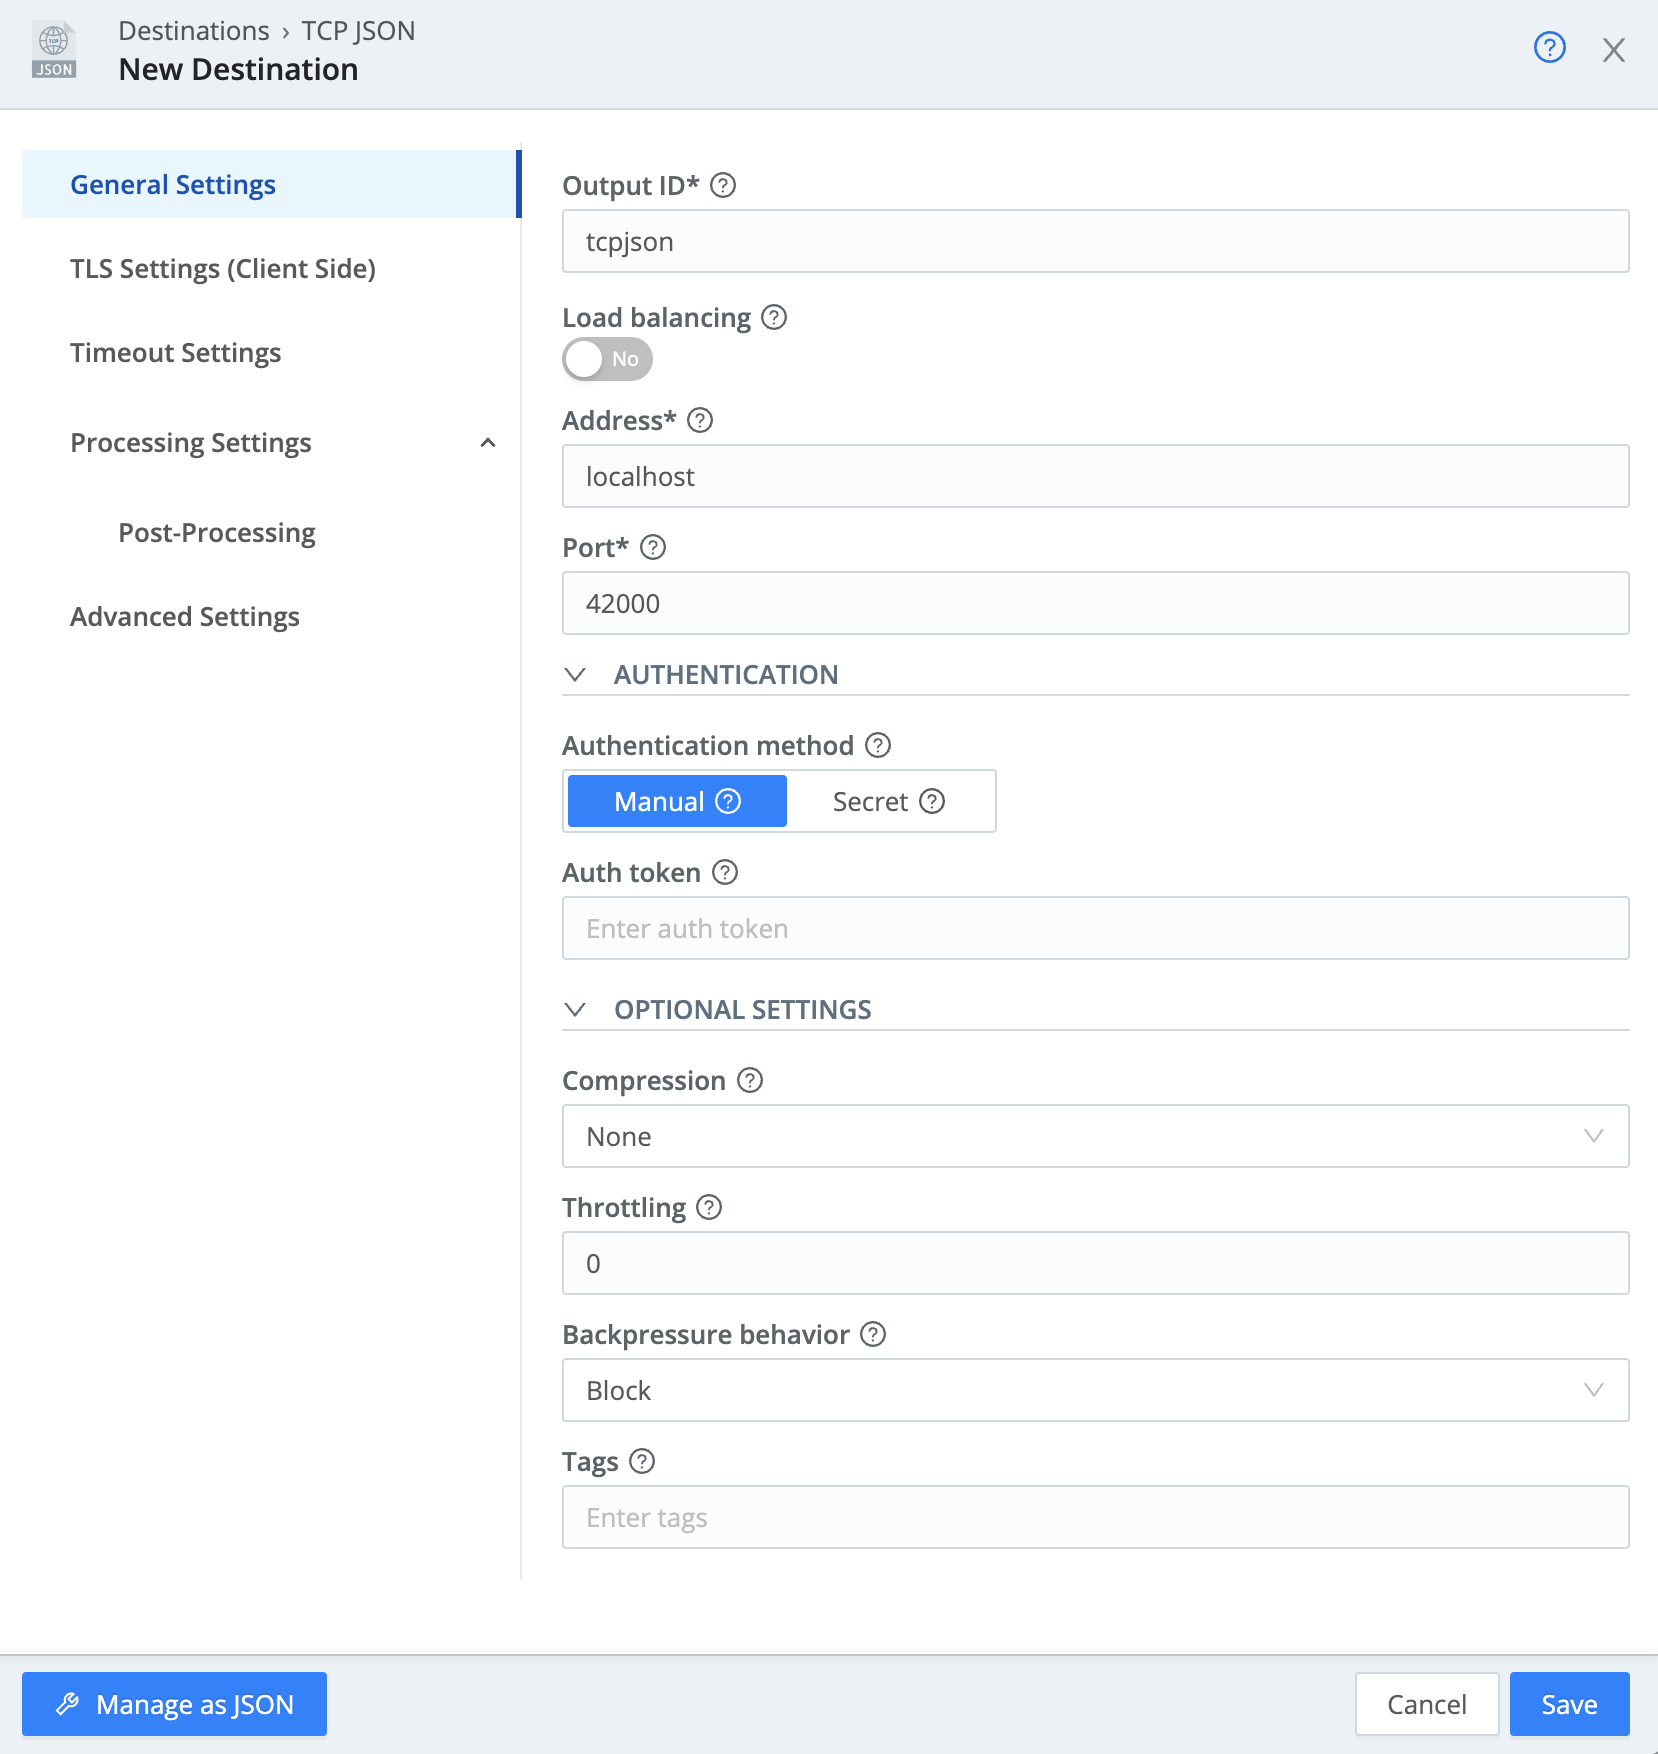
+ Add Newat the upper right. - For
Output ID, typetcpjson.
This can be anything – make it meaningful to the administrator. - For
Address, enterlocalhost. - For
Port, enter42000. - Click
Save.
Your settings should now look like this:
important
Set Default Output
- Select
Defaulton the left. - Click on the
defaultdestination. - Set the
Default Output IDdrop-down totcpjson. - Click
Save. - Click
TCP JSONin the left sidebar.
Our new output should show a red status indicator, because we cannot connect to anything. If you click on Monitoring, you'll see that now events are neither coming in or going out, because nothing is listening on port 42000 on localhost to send data out to.
This is called backpressure. Since we cannot send any data out, we are refusing to accept input from our current HTTP connection. It's up to the client to know to retry if we cannot accept that data. On streaming inputs like TCP, we will stop reading data on that TCP connection. We can validate this ourselves, with curl.
important
Observe backpressure with curl
- In the terminal, run this
curlcommand. Observe that it will time out after 5 seconds.curl -m 5 -v -X POST -d '{"_raw":"foo"}' -H "Content-Type: application/json" http://localhost:10080/cribl/_bulk
Let's start listening on that port. We're going to start up nc, or netcat, in our shell to listen on a TCP port, and we'll output that data to stdout. We'll also use jq to format the data and make it easier to read.
important
Run nc
- In the terminal at the bottom right, run the following command:
nc -lkp 42000 | jq .
This can take a few seconds to show results, perhaps up to a minute. Since we haven't been able to connect to TCP port 42000, our reconnect algorithm has backed off to retrying only once every few seconds.
Once data starts flowing, you should see some Key=Value logs coming through, with sourcetype set to business_event. In your Monitoring screen above, you should start seeing events flowing as well. You've now constructed a full Pipeline:

Next, we're going to learn about some higher-level concepts, including captures and expressions. Keep the terminal open, to maintain the data flow for our first capture.