What's in the Box?
Immediately, we are greeted by nine Data Routes (plus the default route makes 10). Each one has a specific use case that is denoted by the Route Name. You can explore them on your own time.
On the right side of the screen, we can see that this Pack came with some Samples as well. The Sample Data allow us to see what a certain Pipeline is actually doing to our data before we move it into production.
Most log processing applications are CLI based on a ‘cross your fingers and restart it’ approach to parsing your data. Being able to test your Functions and see the Output prior to putting the Pipeline into production (and without restarting Stream) is a huge differentiator for Cribl.
If we expand the first Route, Traffic, we can see the Pipeline it uses is also part of this Pack, pan_traffic.
Click the chain (link) icon next to pan_traffic
Welcome to your first real Pipeline. We are just passing through, but we can see some cool stuff by opening the Sample in the right pane.
Look at the Sample Data
- Click
Simplein the Preview column for pan_traffic.log - Click
Outon the top left OR ClickRunon the top right
If we look back to the Pipeline and expand the first Function (a comment), it will explain what we see on the right.
This Pipeline will process PAN Traffic logs.
There are multiple sections to this Pipeline.
- #2 Simple
Evalto set thehost,sourcetype,source,index, and cleanup the_raw messageto remove thesyslogheader - #3-4 Use the
Auto TimestampFunction to set theeventtimestamp to thegenerated time - #5 Reshape the
Eventsusing theParserto remove unnecessary fields - #6-8 Sample
Events - #9-11 Drop
logswithsubtypeofstart
We can see the evidence of this by the nice color coding in the Preview pane (the right side of the screen):
- Green is a net new field. A field was added to the event by Stream. This is usually when you are separating information from a long
_rawfield or if you want to enrich the event by adding something not there, like thehostorindex. - Orange is a modified field. Here, something was changed. The field isn’t new and the field wasn’t deleted, but some information was changed. This is usually done when cleaning up a dirty field, like getting rid of the time stamp in
_raw. - Red is a deleted field. This field and information were deleted from the event. To reduce size, original fields are deleted after useful information is pulled out, cleaned up, or put into other fields.
That’s a lot of stuff going on. Let’s see if it does what Steve asked for, though.
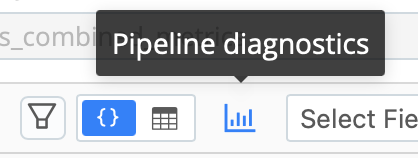
Click the Bar Graph icon in the top right of the preview pane.
True to their word, this Pipeline reduced the size of our Palo Alto log sample by ~30%. Well if we look at actual bytes, then it was ~50%!
Let’s move this Pack into Production!