Interposing
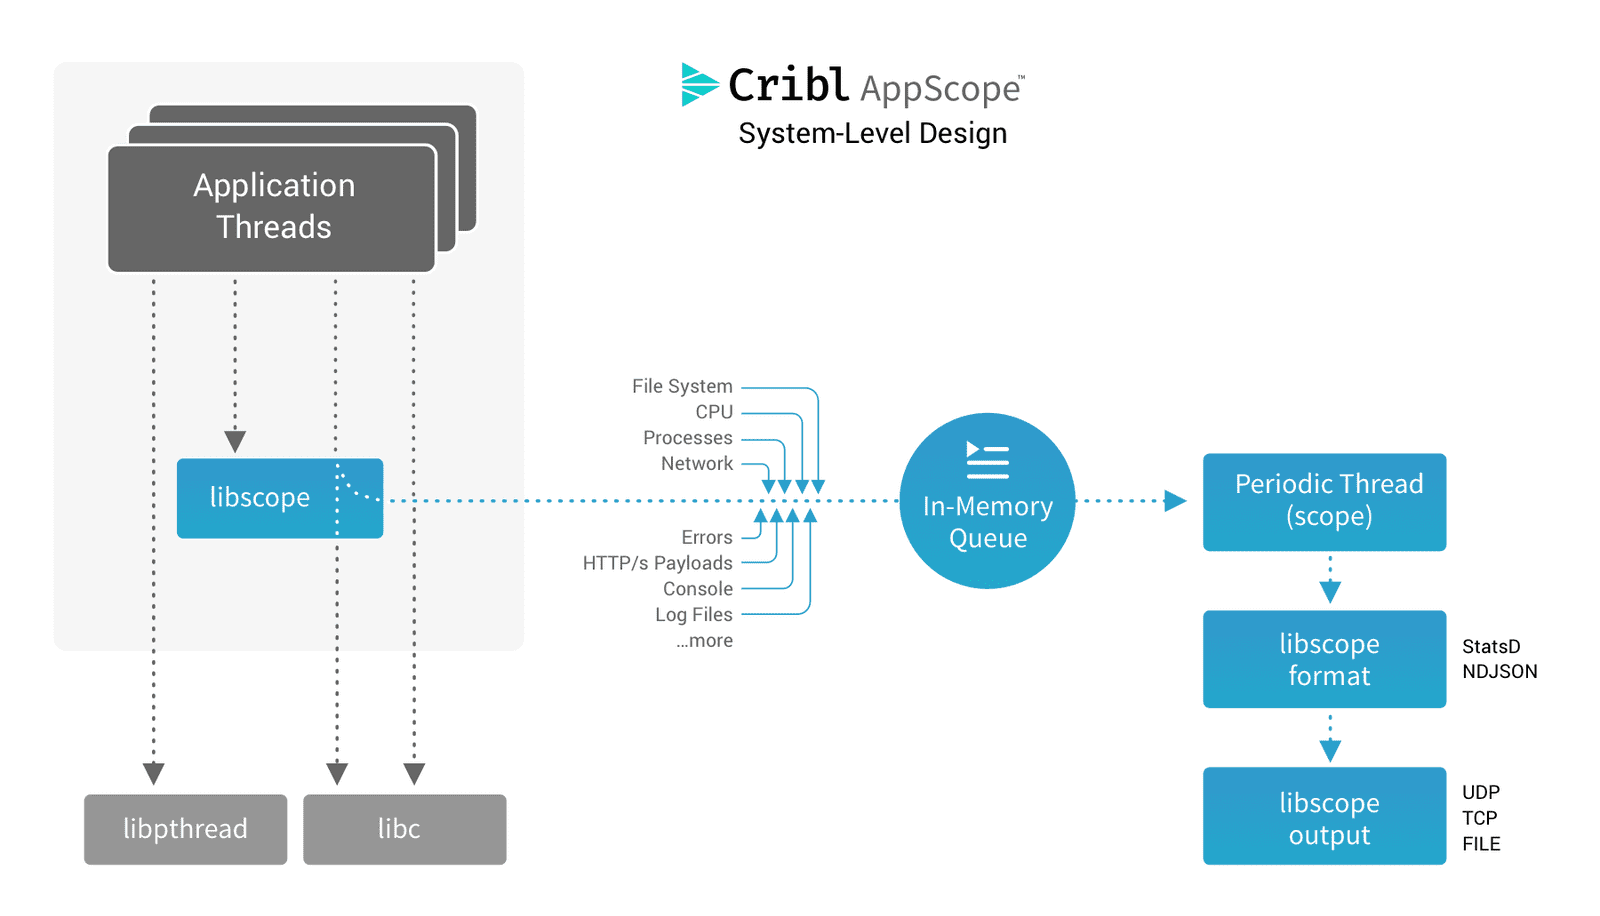
Let's look a bit more into how AppScope gathers this information. The AppScope library (libscope) is the core component that resides in application processes, extracting data as an application executes. You can closely configure the library's behavior using environment variables or a configuration file. The scope CLI wraps this library, making for a simple experience in scope'ing applications and working with the captured information. The scope CLI also makes it easy to configure the library to send data to third parties.
The library extracts information by interposing functions. When an application calls a function, it actually calls a function of the same name in libscope, which extracts details from the function. Then the original function call proceeds. This interposition of function calls requires no change to an application: it works with unmodified binaries, and its CPU and memory overhead is minimal.

Because libscope.so runs in userland, inside your application, that means we can observe not only system calls, but also calls to popular shared libraries like OpenSSL. This allows us to not only see that a network connection was created, but to also see the payload bytes, even if they're encrypted.
Scoping Apps
Enough theory, let's see what we can see from AppScope's perspective. AppScope works on anything, no matter the runtime. Let's scope something older, like, perl:
Scope Perl
- In Terminal 1, run:
scope perl -e 'print "foo\n"' - In Terminal 1, run:
scope events
There are a few takeaways from what we're seeing from scope events. AppScope picked up several file opens. Running a perl program that simply outputs to the console also opens /dev/urandom and /dev/null. That's really interesting.
This highlights a couple of areas that make AppScope unique. Since the output is designed to be consumed by operators and security, we're expressly deciding to output human-consumable events: things the application is doing that make sense to someone trying to understand it from the output.
Tools like strace and tcpdump output incredibly high-fidelity information that requires the user to write parsers and analyzers to attempt to distill a ton of raw information into what AppScope gives you out of the box.
AppScope can be configured to output basically every library or system call too, but that is likely to be helpful only to a developer. To someone running the application who did not write it, first we want to understand behaviors that have interactions with other resources: files opened, network traffic, DNS requests, and application-level interactions like HTTP.
Second, gathering this information is incredibly simple. Just prepend scope to your command, and you're done. What we've just done, while simple, is amazing. We took an unmodified Linux binary like perl and without any configuration changes or any code modifications, we're understanding immediately what it's doing.
Calling scope and then giving it your command is actually short for scope run, and works fine in most cases. If you want to pass parameters to scope run, there's a more detailed syntax that allows this. In our next example, we're going to dial up the metric verbosity so we can see time series with greater dimensionality. Default verbosity works for most production use cases, but sometimes you're already up at 10 and you just need one more:
Scope Perl Verbosity 11
- In Terminal 1, run:
scope run -v 11 -- perl -e 'print "foo\n"' - In Terminal 1, run:
scope metrics
With verbosity at 11, we output a metric for nearly every operation at full cardinality. Again, not something we recommend by default. By dialing up the verbosity, we can see some other interesting behavior, where perl is looking for a number of shared libraries but not finding them, thus showing fs.error metrics for files like /usr/lib/x86_64-linux-gnu/perl-base/5.26.1/x86_64-linux-gnu-thread-multi.
AppScope is highly configurable at runtime. The scope CLI abstracts much of this complexity away for single user investigations, but these parameters can be very handy when running as an agent. Let's examine our configuration file for scope:
Look at Scope Configuration
- In Terminal 1, run:
cat $(scope hist -d)/scope.yml
For more detailed info, check out the docs on our configuration files. Let's highlight a few specifics. First, under metrics, you can see where our verbosity is upped to 11. We're configuring libscope.so to output NDJSON events to files in a directory created by the CLI to store data for this session. Using scope run --cribldest, scope run --metricdest and scope run --eventdest we can have the CLI output different properties to have libscope.so send data in open formats to third party tools. We'll be covering that later. You can see in scope.yml that we can configure metric and event information separately, and events have an important section called watch which determines what libscope.so should output as events. The CLI by default looks for everything, but in production you might want to dial down to specific events you want to output, say HTTP only but not Filesystem.
Watch type file is interesting, and our next section is going to dive in to how AppScope also can be used to collect information on what an application is doing on the filesystem and collect log data written by the application automatically, without configuring a separate log agent.